


Chapter 5
Card sorting analysis: How to read results and reach insights
You’ve completed your card sorting test. You’ve identified objectives, chosen a card sort method, and launched the study. You’re on your way to understanding how your users categorize and understandthe information on your website or digital product.
There’s just one thing keeping you from taking the results and uncovering actionable user insights—and that’s card sorting analysis.
Whether you’re conducting a card sorting study to improve labeling of content, develop information architecture, or you’re looking for a deeper understanding of your users’ mental models—analyzing your card sort data is an essential step in this UX research process.
In this chapter of our guide to card sorting, we’ll cover a step-by-step process for card sorting analysis and reaching those insights.


Card sorting analysis: Open card sorting vs. closed card sorting
Before diving into what the cards are telling you, you’ll need to determine your approach based on the type of card sorting test you ran.
To recap chapter one, there are three types of card sorting:
- Open card sorting: A generative research method, open card sorts consist of participants sorting cards into categories of their own creation
- Closed card sorting: This is an evaluative research type where users organize cards into predefined categories
- Hybrid card sorting: Hybrid card sorting is a combination of open and closed card sorting—some categories may be defined from the get-go, while participants can also create their own new categories
Open and closed card sorting affects the focus of your analysis rather than the exact method. In open card sorting analysis, emerging trends will provide you guidance for building information architecture from scratch. With closed card sorting, you’re validating—or disproving—existing information architecture.
For example, in an open card sort, you’re looking for patterns that indicate consistent mental models amongst your rusers. The results can form the foundation of your user personas and inform your information architecture. By reading through the esearch panel’s chosen category names, you’ll also have a better grasp of the terminology your user base finds natural for organizing content.
With closed card sorting, you want to keep your eyes peeled for how users are organizing concepts and whether this aligns (or how drastically it misaligns) from your existing information architecture or organization. If certain cards are consistently put in different categories, that also suggests they’re confusing to users or could be divided into multiple topics.
Now that you know what to look for—let’s get into how you’ll find it.
💡 Need a hand recruiting participants for card sorting? Maze Panel and Maze Reach provide the tools necessary to help you recruit, sort, and manage user research participants.
Analyzing card sorting results: A step-by-step guide
Whether you’re conducting card sorting to inform your information architecture, understand how your users think, or gather naming ideas, a successful card sort will ensure your product and user experience is aligned to your user’s mental models. However, the correct data analysis process and understanding your card sorting results is crucial to ensure you’re drawing the right conclusions.
Let’s go through the step-by-step process for manually analyzing your card sorting results. For a quicker and easier way of analyzing card sorting results, you can utilize card sorting tools, or scroll down to where we run you through Maze’s collection of card sorting analysis methods and functionalities.
1. Review data for big-picture insights
Unsurprisingly, identifying impactful insights starts with reviewing your card sort data. Begin by reading through your results and look for any interesting patterns that emerge, or groupings that jump out at you. No need to get to the nitty-gritty, just look for broader implications on user experience.
If you’ve conducted an open card sort, look for the most commonly-created categories among your tailored participant database (this is especially useful if you’ve conducted multiple card sorting sessions). You can then use these categories as a basis for your information architecture moving forward.
For closed card sorts, trends may not be so apparent. You’re dealing with previously-established categories—so you’ll need to rely on comparing your results. Look for anything that sticks out in your user research, such as categories not being used at all or a number of cards consistently sorted in a category different from those on your website.
Some other patterns and themes may include:
- Consistent groupings: If participants are constantly grouping the same cards into a single category together, that indicates a shared mental model of how these concepts should be grouped on your website.
- Overused categories: If participants are over-grouping cards into a single category, it suggests that your category is too broad, so you’ll need to add another, more specific category for these concepts.
- Cross-categorization: Cards appearing in multiple categories suggest these concepts need to be accessible from multiple points in your information architecture.
2. Clean and standardize your data
You don’t just want card sorting insights—you need accurate card sorting insights to take your information architecture to the next level. To get that, you’ll need to round up your data in one place and make it squeaky clean before sending it off for further analysis.
This is especially important if you plan on identifying numerical trends when analyzing your data later. It’s easy to drown in a sea of numerical data if you don’t have the right vessel to organize your data consistently.
If your card sort used physical cards, you’ll need to transfer results to a digital format for data consolidation. Most product teams and researchers use spreadsheets for this, but if you want faster results, sign up for a specialized card-sorting tool. For example, Maze’s Card Sorting solution is intuitive and quick to set up—helping you get in-depth insights, faster.
Now, let’s say you’ve run an in-person card sorting. A spreadsheet with its endless rows and cells sets the stage for organizing and standardizing your data. You can build upon the table below as a basic model. But for the best results, go wild—enter everything. You can filter down later.
While you’re inputting results in your spreadsheet, make sure you leave out any erroneous entries or instances where a participant has left the sort incomplete, as this can skew the data. .
Take note that if you’re running into a large amount of incomplete data, it could indicate that your test may be confusing and needs re-evaluation. Set these incomplete entries aside for later assessment.
If you’ve conducted open or hybrid card sorting, you’ll also need to standardize the categories users have assigned. For example, some users may have labeled a category as ‘about us’, while others may have labeled the same category as ‘about the company’.
Look for categories that essentially mean the same thing and select a standardized version to move forward with. For example:
- Contact us/Get in touch
- Customer support/Help center
- Pricing/Plans
- Products/Our products
With your data clean and standardized, you’re ready to move on to manually analyzing your card sort.
3. Analyze your card sorts manually
When analyzing your cards, there are two methods to choose from:
- Quantitative data analysis
- Qualitative data analysis
Both types deliver unique customer insights derived from your card sorting results, and there are key differences in the types of insights you’ll get from either.
Let’s take a look at both of these methods and their places in your analysis.
Quantitative analysis of card sorting results
The main goal of quantitative analysis for your card sorting study is to identify key trends and commonalities. Analyze the data, establish metrics, and understand which groups are most common. You'll get a clear insight into what is intuitive for users.
Quantitative analysis for card sorting mostly falls into statistical analysis with three especially useful methods and diagrams:
- Clustering
- Dendrograms
- Matrix Spreadsheets
Clustering

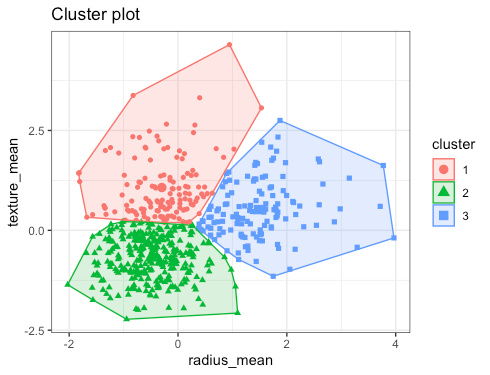
Clustering involves exactly what you’d think: clustering analysis results together. The closer the objects in a cluster are, the more similar they are. When analyzing your card sorting results using this method, cards will appear as clusters based on how frequently they were grouped together by participants.
Dendrograms

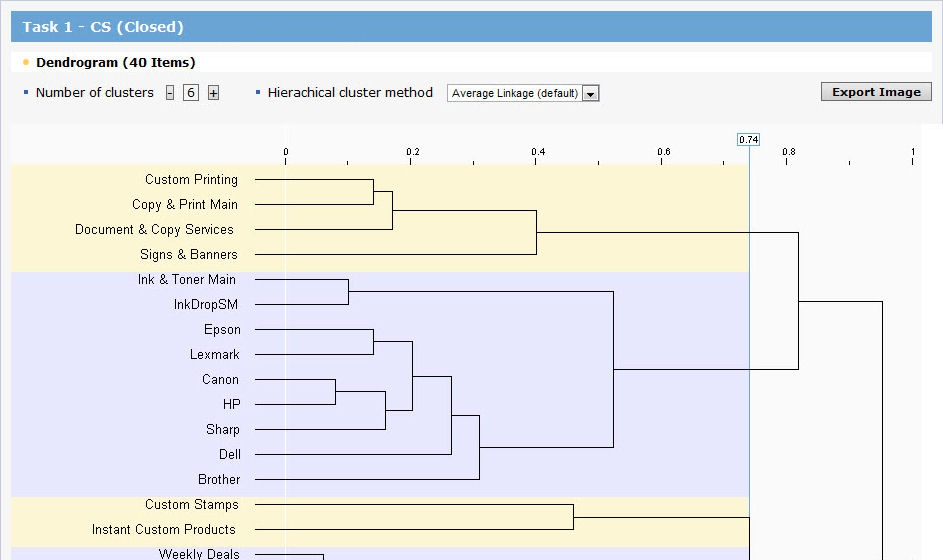
Dendrograms are tree-like diagrams that uncover the hierarchical relationships between different data points. They help you visualize popular groups of cards and how users intuitively organize them under multiple categories.
UX teams can use dendrograms as information architecture blueprints to map out content categories and their relevant concepts. In a dendrogram, each card will occupy a branch, while the node indicates their group.
Matrix spreadsheets

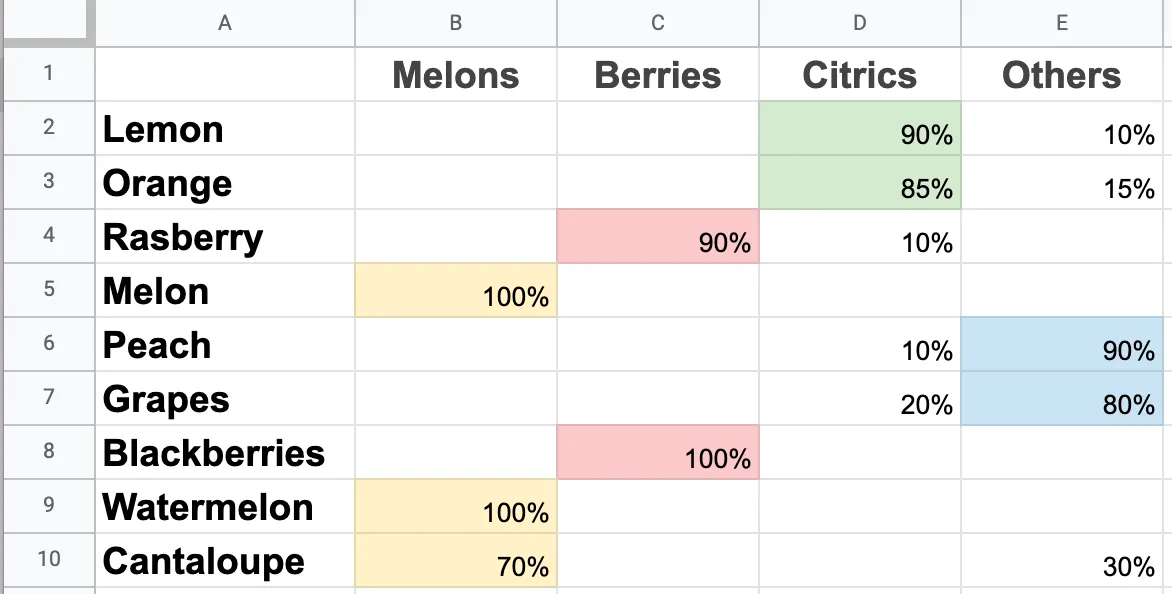
You can use a matrix spreadsheet to identify which groups cards were most frequently sorted into. You can use numbers instead of percentages, but percentages make it easier to understand the affinity of a group.
Using a matrix spreadsheet helps you quickly work out which cards were grouped together most frequently. They give you precise insights into how your participants categorize and group information together.
While you can build your own matrix spreadsheet manually, the right tool makes the process more efficient—especially for large amounts of data. Many online card sorting tools and statistical analysis software have built-in card sorting result analysis to help create clusters, dendrograms, and matrix spreadsheets.
Maze not only lets you conduct card sorting tests for information architecture insights but also lets you analyze the results with similarity and agreement matrices. It’s a quick and easy way to start getting insights into your user's mental models today.
So, that’s how you get numbers. But, what if you’re interested in why participants group cards together the way they did?
Qualitative analysis of card sorting results
Similar to techniques like thematic analysis and affinity diagrams, qualitative research and analysis of your card sorting data is about hunting for patterns and themes.
Instead of looking at numerical data, you’re forming a deeper understanding of the choices users made during the sorting. Your clues to look out for are consistent sorting patterns, groups, and category names.
If you’ve done moderated card sorting or hosted follow-up user interviews, transcripts and notes can give you more in-depth reasoning on participants' category choices and themes. Since you’re not receiving additional information on your participant's choices with unmoderated card sorting, your insights may be more limited with less contextual information.
Prepare a list based on your findings. For example:
- Many users grouped ‘User Testimonials’, ‘Client Success Stories’, and ‘Project Highlights’ under a category they termed ‘What we do’
- Most users grouped ‘Blog’, ‘Industry News’ and ‘Case Studies’ under our ‘Industry Insights’ category rather than ‘Resources’
- Most users didn’t use the assigned category ‘Our journey’ but rather grouped the concepts assigned to the category ‘About us’
Qualitative card sorting analysis can yield deeper insights than quantitative, but going through data and making sense of results can be resource intensive (depending on how many users you tested with). However, you don’t need that much data for qualitative analysis since you’re not making statistical generalizations, so you can run card sorts with a lower number of participants.
4. Share your findings with stakeholders
To ensure your insights become solutions, you’ll need to share them with key stakeholders. Creating a UX research report is the most effective and simplest way to do so. Your reports should contain all the relevant information from your card sorting, so you’ll want to include:
- Your chosen technique (in this case, open, closed, or hybrid card sorting), why you chose it, and how it works towards your research plan and objectives
- The tester demographic and how you recruited research participants
- In-depth results, findings, and insights derived from your card sorting
Go a step further and add a segment for solutions based on your insights, and how these will impact your UX roadmap and research strategy. Drawing up a few recommendations for further action will help guide stakeholders toward implementing the insights and show the full value of your work.
Analyzing your card sort with Maze
Now, if all the above seems like a lot of manual work—there’s another way to get insights from card sorting data.
If you’re in a time crunch and eager to get those insights, a UX research tool like Maze can make all the difference.
Here’s how.
1. Agreement matrices

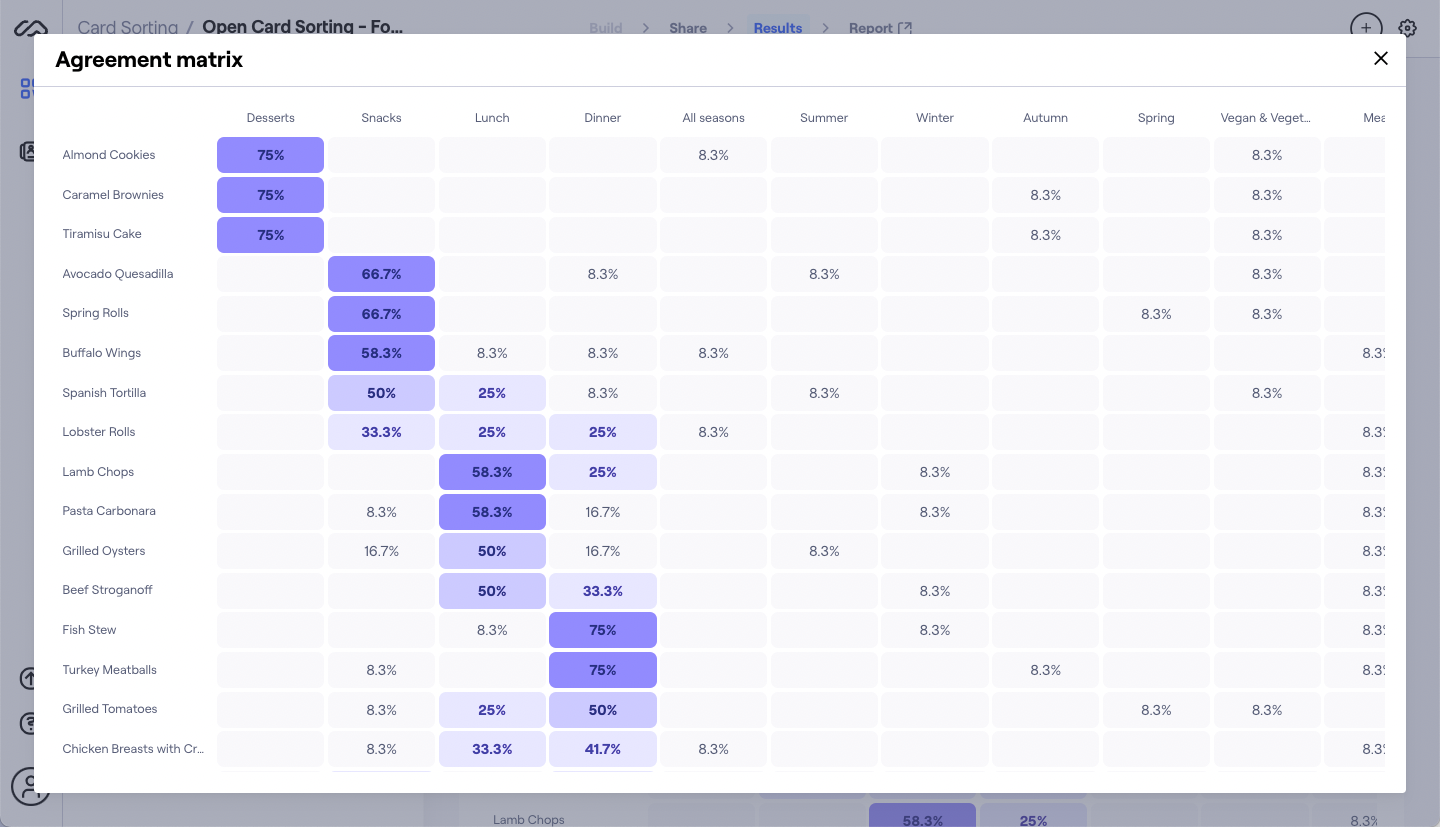
Maze’s agreement matrix helps you easily understand the most popular groupings of individual cards and their category labels. The rows indicate cards, while the columns indicate categories. Each cell tells you the agreement rate for every card under each category.
It’s similar to the matrix spreadsheet you’d create when manually analyzing data, except this is created automatically in seconds. This speeds up your whole analyzing process, getting you your results faster, and with less manual work on your part.
More popular choices are at the top of the matrix—the darker the cell, the higher the agreement rate for the category. Agreement matrices help you easily visualize card sorting results from remote user testing, indicating how often users agree on card placements.
2. Similarity matrices

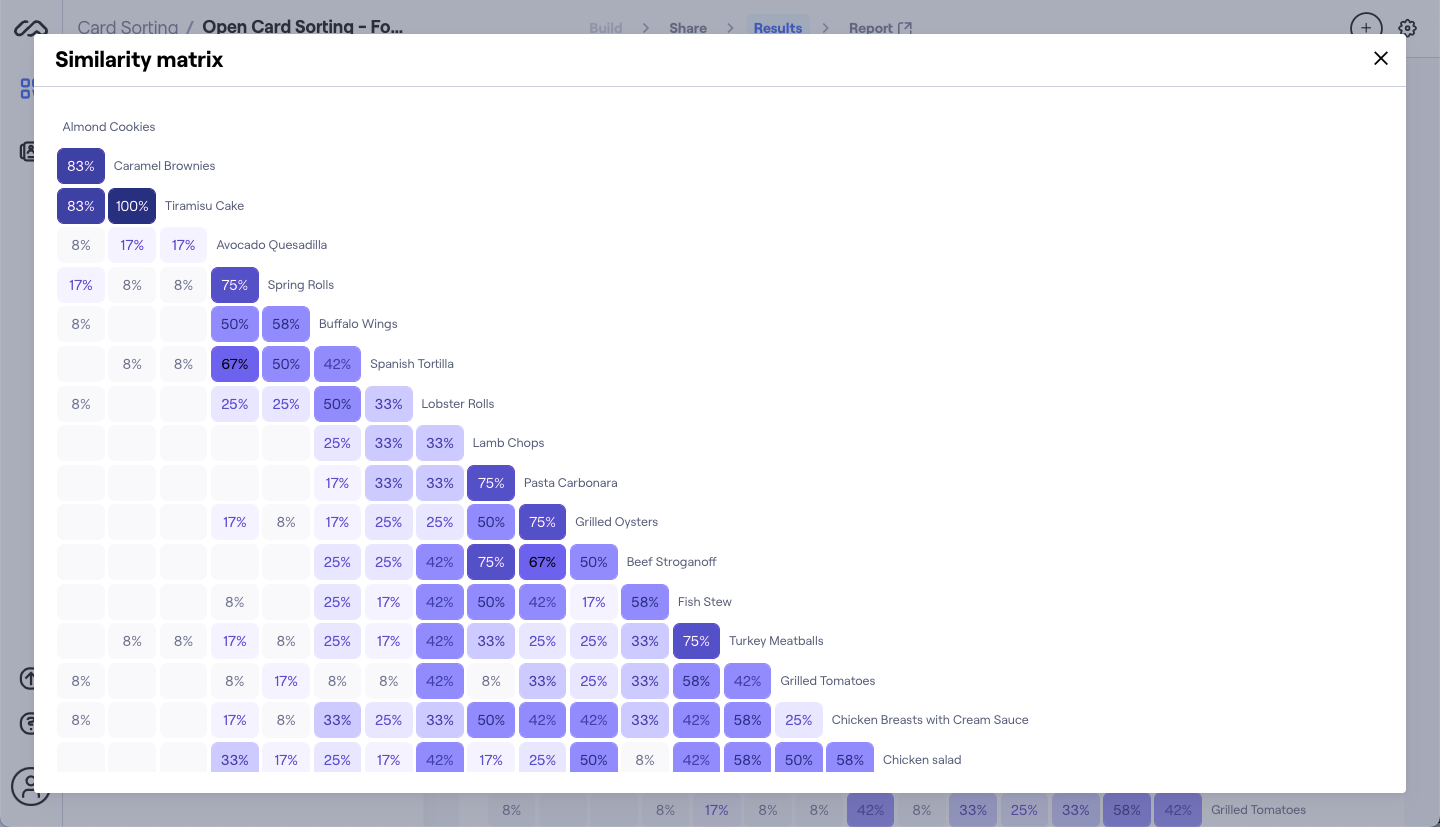
Maze’s similarity matrix helps you understand the relationship between pairs of cards:
- The closer-related pairs will appear on the edges of the matrix
- The darker the cells, the stronger the relationship between these pairs
Using Maze’s similarity matrix is a quick and easy way to understand which cards go together according to users without manually sorting through card sorting data. It also rapidly speeds up sifting through multiple cards to spot repeated themes or different terms for the same item.
TL;DR: Analyzing card sorting insights for better UX
Card sorting insights can reveal gaps in your website, help you establish intuitive information architecture, and give you in-depth knowledge of your users’ mental models. Making changes to your website's content categories to better align them with your users’ expectations provides an altogether smoother experience.
However, you can only access these insights with the right analysis. This final step of this product research method involves reviewing results for big-picture insights and standardizing your data.
You can then use quantitative analysis to help you understand the relationship between cards, groupings, and their categories. Qualitative analysis, on the other hand, will require reviewing your results to unpick in-depth trends and reasons behind your participants’ choices.
Work through all that data, and you’re left with a direct understanding of how to build information architecture consistent with user intuition.


Frequently asked questions about card sorting analysis
What are the types of card sorts?
What are the types of card sorts?
There are three main types of card sorting: open, closed, and hybrid card sorting. Open card sorts ask participants to group cards into categories of their own creation. Closed card sorting has participants organize cards into predefined categories, while hybrid card sorting is a combination of open and closed.
What is the result of card sorting?
What is the result of card sorting?
Card sorting results in insights into users’ mental models, their thought processes on labeling information, and how they group concepts into categories. Using these insights, UX designers can create or redesign information architecture to make it more intuitive for users.
What is a card sorting analysis spreadsheet?
What is a card sorting analysis spreadsheet?
A card sorting analysis spreadsheet is a tool for consolidating your card sorting data in one place. This spreadsheet also helps turn data into actionable insights by identifying the relationship between cards, their groupings, and categories.