


Chapter 11
How to create effective UX research reports that actually engage stakeholders
Regardless of how thorough or valuable your user research is, it quickly becomes meaningless if you’re unable to succinctly put it together and present it in a digestible UX research report.
UX research reporting is a skill just as valuable as being able to conduct the research in the first place. It lets you showcase methodology and findings of your research, and ensure a product’s user experience delivers with the first iteration.
Luckily, how to write and present UX research reports is something you can learn. What’s more, this chapter will guide you through it (and provide free templates for your UX report).
TL;DR
- A UX research report summarizes research goals, methods, findings, and recommendations to guide product decisions
- It should be clear, concise, and user-focused, highlighting actionable insights rather than excessive methodology
- Format to suit your audience: workshops, Slack updates, slide decks, PDFs, video, or atomic nuggets
- Tailor content to stakeholders (PMs, designers, execs) and avoid unnecessary jargon
- AI and tools like Maze can help automate report generation and make findings easier to digest and share
What is a UX research report?
A user research report is an easy-to-digest summary of a user research project that aims to update product stakeholders on results, inform product decisions with user data, and harmoniously guide a product build or iteration.
Once upon a time, UX research reporting was a cumbersome, dreaded box to tick. It was notorious for resulting in unnavigable reports that product teams would rather leave at the bottom of their inbox than try to consume.
The word 'report' conjures images of lengthy word documents, screenshots, a PDF one-pager, or an hour-long presentation with an occasional GIF—but a research report doesn't have to mean that.
Kevin Rapley, Senior User Researcher at Justice Digital, explains a UX report as being “about arming our teammates with data that allows them to decide on the direction of a product or service.”
A useful UX report includes:
- The research goals and research process
- Research questions the report is hoping to answer
- A recap of the UX research plan
- What UX research methods were used and why
- Quantitative and qualitative data sets and conclusions
- Insights & key takeaways
- An expanded data appendix
Why do you need a user research report?
Product teams need a user research report to reflect on research activities and accurately guide a product’s scope with key insights. A UX research report helps sort information, defend research, and affirm (or disprove) a hypothesis. No matter how well-organized your research repository is, sometimes simply having the research results available is not enough. A succinct report will align entire teams in one sitting by presenting findings in a unique way.
In short, a research report helps to:
- Positively influence UX design
- Make sense of data sets and explain complicated graphs or other quantitative research results
- Provide actionable recommendations on next steps
- Summarize findings, so they can be translated into every role and responsibility of the product team
Where UX research enables product teams to understand the user, prove or disprove hypotheses, and prioritize and generate ideas, a UX research report ensures the user is at the center of every product decision. Presenting that UX report then aligns team members on goals and priorities, and provides authentic user insights to inform every product decision.
Tip 💡
We’ve covered what a research report is, but what is it not? A UX research report is not a static, one-time document that your team reads once. It’s an ongoing reference point; the guardrails and guiding insights that guarantees the entire build stays on track.
How to write an effective UX research report: the essential elements
No matter how you choose to present your research study, there are a few elements that every report needs to include for it to be both useful and effective. Let’s look at how to create a report.
Introduction
Your introduction should lay out your research goals, plan, and scope. It should cover your product team’s pain points, and give a clear study overview. You need to answer what you did and why. The introduction can go on to include sales support data and competitive product analysis that inspired or guided this research project.
It’s a good idea to set up how this research helps to support and answer related company goals, team-level goals, and product-dev goals: so all stakeholders know it’s got something for them.
You can include questions from your UX research strategy you had originally hoped to answer, even if your results have gone on to answer other questions as well. Now’s also a good time to introduce research stakeholders: your fellow research team members.
As a secondary step to your introduction, ensure you’re including the approach you took to your UX research process: i.e. what research methods you used, as well as participant profiles and your user personas.
Don’t feel you need to spend too much time on this, says Charlie Herbozo Vidal, Senior User Experience Researcher at CVS Health. “As researchers, it’s not uncommon to dwell on the methodology for longer than needed. While interrogating methods might be valuable to other researchers, business partners might be disengaged by them.”
Ultimately, while methodology is important, it’s the results that most people are here for.
Key findings
This is where you get people on the edge of their seats! Give an overview of your findings before breaking them down into more detail. Remind your audience of ‘what we thought’ vs. what you actually learned.
Artifacts to use are:
- User personas built
- Insights from customer interviews
- User journey maps
- Prototype testing
- Storyboards
- Feedback & satisfaction reports
At the end of this section, and continuing throughout your presentation, you can pepper in relevant atomic research nuggets.
Make sure you champion the user's needs throughout, and make special notes of 'offhand' comments users make. Often, it's the random comments that provide the most insight—they must not be forgotten about when writing the report.
Jack Dyer
Designer at Interactive Schools
Share
Next steps
Summarize your quantitative and qualitative research, and how they’ll both impact your product design and growth. Lay out opportunities versus risks, good-to-knows versus must-knows. Here you’ll want to convey the impact of each suggested step, roadmap designs, and figure out the long and short-term project scope. A few things to cover in your next steps are:
- Long and short-term goals
- ICE framework (Impact, confidence, ease)
- Roles and responsibilities for each task
- A timeline of events and project map
- A request for resources
- Desired outcomes
Q&A
No matter how you’re presenting your research, be it asynchronously or not, you’ll need to include a Q&A. These can be subjective (based on what you think your team is likely to ask), pre-collected ahead of the presentation, answered live, or an opportunity to build an FAQ later.
What’s important is to acknowledge and be open to receiving questions. After all, questions are a positive thing—it means people are actually listening!
Appendix
It’s easy to overlook the appendix after putting together a detailed report, but all that glorious research data needs to be accounted for and referenced clearly. Plus, you never know to what extent your team will want to dive into it. Your appendix is also where you’ll want to include secondary research that didn’t make the cut but backs up your research.
9 ways to present UX research findings
UX research reporting will look a little different depending on your internal personas and organizational culture. First, ask yourself: who is your audience? Who needs to see the report, and who will benefit from seeing it? This will help determine how to present your user research report.
A few things to consider:
- Are you working with internal or external stakeholders? Tool limitation and file-sharing will differ for both.
- Are you working with an in-office, fully-remote, or hybrid team?
- Are you sitting in the same time zone or not?
- What are the knowledge levels like within your team?
- How does your team communicate daily/weekly/monthly?
- Are there any predetermined knowledge bases or tools your team is comfortable with?
The most common players across a UX team that need to understand your UX research report are:
- Product Managers
- Product Designers (UX/UI)
- Fellow Product Researchers
- UX/UI Writers
However, it doesn’t stop at your product decision-making team. More often than not, there will be other stakeholders who can benefit from your research presentation. Your marketing, finance, sales, and even C-suite executives will massively benefit from your findings too. If you can tailor versions of your report or provide key summaries for each collective, even better!
Psst 👉 This is much easier to do when you have a research team that can host stakeholder interviews ahead of your research process.
Now, let’s get into the report formats to consider:
1. Workshops: For real-time, collaborative reports

First up, workshops. Workshops are a unique way of keeping your report interactive and engaging. They can be held remotely or in-person, but are almost impossible to hold asynchronously—so time zones are a big factor here.
You’ll also want to consider workshopping tools if you’re hosting digitally—a few to consider are: Miro, Mural, FigJam, and Gather.
A plus with workshops is that your stakeholders will actively have a say early on in the product development process, allowing you to foster more diverse inputs, minimize research bias you may have accumulated in your summaries, and build a sense of responsibility for the product’s success early on.
A negative of workshops is that they can be culprits to in-the-room or bandwagon bias. People are quick to ride on the coattails of a strong conclusion, without fully understanding or trialing another (less popular) conclusion or suggestion.
2. Slack channels: For an asynchronous and interactive research repository
Slack is a great option (especially if you’re already using it) if your research team needs to deliver insights to a fully-distributed collection of stakeholders. Slack tends to be the go-to channel for startups and creative companies, and there’s some key features you can tap into:
- Canvas: Store files, images, videos, and more in one place
- Huddles: Jump on a quick chat to fill in any gaps
- Clips: Post audio, video, or screen-sharing clips
- Connect: Team up with freelancers and agencies working on the project with you
- Workflow: Build drag-and-drop processes from your findings
- Knowledge sharing: Tag your data accordingly so it's easy to find later
3. Knowledge bases: For self-serve UX research reports
Knowledge bases can be a great home for your research presentation, and work especially well for distributed teams working across different time zones.
However your team is set up, research repositories are incredibly valuable. Sharing your report in a centralized location, regardless of the other ways you distribute findings, can democratize research, showcase the impact of your work, and disseminate valuable insights throughout your entire organization.
Keep in mind that knowledge bases can be tough to navigate if poorly organized or tagged. If you’re storing your UX research report in a knowledge base, ensure you provide clear instructions on how someone can find it, and how to navigate through the report itself.
Pro tip ✨
If you have the time, run a card sorting test with an internal focus group to see how you can logically sort your research for those who are going to be looking for it.
4. Presentations / slide decks: Great for the PAS framework

Live presentations tend to be the most impactful, but do risk being short-lived if you don’t have a follow-up plan for after your presentation.
While they’re great for sharing metrics and visuals, and can provide a beautiful overview of your research project, presentations can be a little one-sided. This one-way presentation style can prevent collaboration and innovation from the rest of the team. Consider how you can make your presentation interactive or engaging, whether it’s taking questions throughout or doing a ‘choose your own adventure’ session and asking people which sections they want to review first.
Kevin Rapley, Senior User Researcher at Justice Digital, recommends presenting slides using the PAS framework:
- Problem: State the problem you set out to overcome
- Agitate: Detail the impact or opportunity missed by not meeting the problem
- Solution: Offer a route forward from the research findings and insights, the next steps, and likely outcomes by solving the problem
Kevin explains that the PAS framework cuts to the detail people are invested in: “Stakeholders want to know the path forward: Are we on the right track to build this service? Have we uncovered user engagement or uptake issues? Have we learned that our assumptions are incorrect and we now have a better understanding of user needs? Presenting slides in this way delivers what’s needed.”
5. Written reports: For direct and simple sharing
If it’s not broken, don’t fix it. A written report is probably the idea that jumped to the front of your mind when you read the title of this chapter. For many, this may seem like the ‘OG’ of UX reports.
These types of reports often come as a PDF or a Word document, making them static, reluctant to change, and resulting in low engagement or re-reads. Delivering a written report via email also means you can’t guarantee your audience is going to read it. On the other hand, written reports can be incredibly detailed, scanable for different stakeholders, and include all kinds of results from visual data to qualitative findings.
For many teams this method still works, especially if you’re trying to communicate findings to a distributed, asynchronous team. Written UX reports enable people to go through things in their own time—and come back to them when they need to.
6. Atomic research nuggets: To eliminate ‘bad research memory’
Deriving from an atom—the smallest unit of matter—atomic UX research nuggets are minute and succinct conclusions from data points. They’re always aligned and tagged with a product direction. Formalized by Tomer Sharon and Daniel Pidcock, it’s described as “the concept of breaking UX research down into its constituent parts”:
Experiments: “We did this…”
Facts: “…and we found out this…”
Insights: “…which makes us think this…”
Conclusions: “…so we’ll do that.”
Atomic research nuggets help to fight ‘bad research memory’—the idea that knowledge gets lost or forgotten amid the depths of a larger report. These nuggets are accessible, usable, and searchable. They can be delivered (or accessed) throughout an entire product build, serving as North Stars for micro goals. Research nuggets can be a firm reminder your team is, or isn’t, taking the right action.

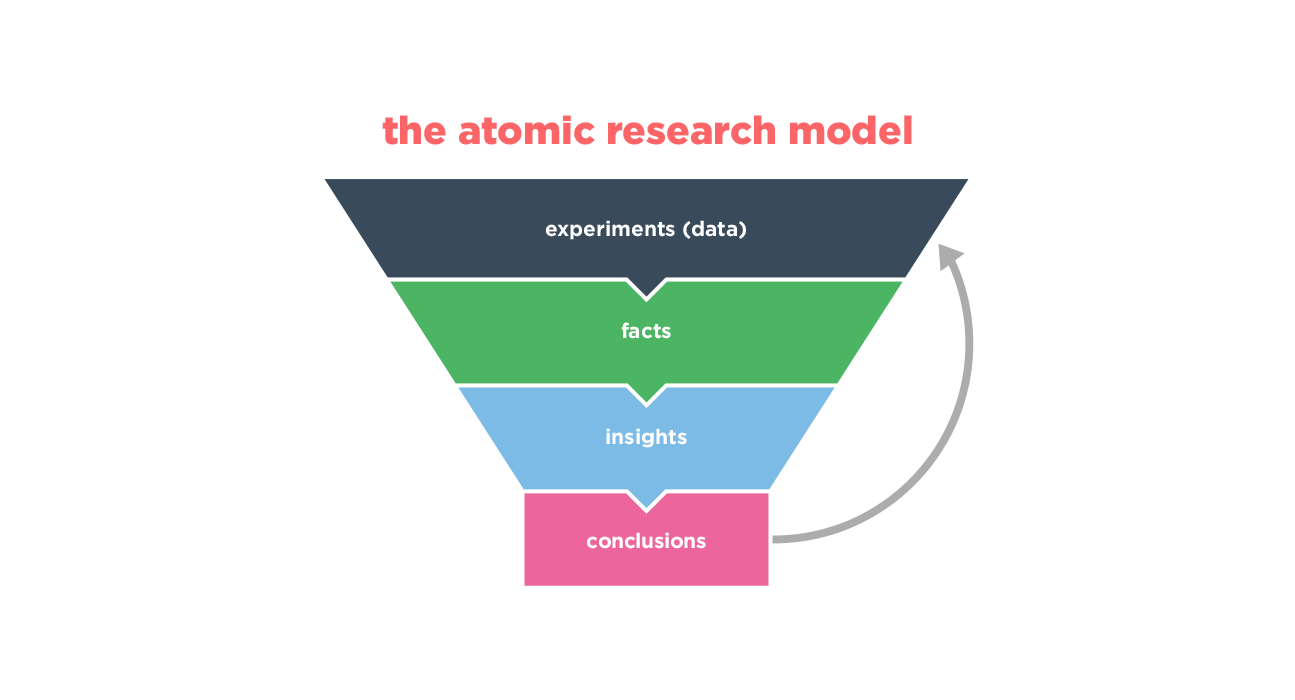
Credit: Daniel Pidcock
7. Pre-recorded video: For better knowledge retention
People retain 90% of the information they receive via video versus text. There’s no question that, for many, video is a better way of onboarding and remembering information. At the same time, it can be easier to share information via video if your UX researchers aren’t the most confident of writers.
Although pre-recorded video is an easy way to share a UX research report with a team, as with other formats on this list, you’ll need to ensure people actually watch it.
Loom can be a great screen-sharing video recording tool. Some of their features and paid plans will enable you to see who from your team has watched your video, as well as spark conversation and engagement opportunities throughout the video. Alternatively, you can share the video as a watch-along during a synchronous meeting and discuss afterwards, while still sharing the video with those who can’t attend live.
8. Case studies: For sticky storytelling
Case studies aren’t just for winning potential customers. At their very core, case studies are put together to convince someone of something due to a real-life story. This is why they can be great if your UX research report needs to convince a diverse or largely cautious selection of stakeholders.
What’s more, case studies tend to rely on storytelling tactics and a strong narrative to get their point across. They can pull from user personas to further a point and make it more relatable for your design team. Muhammad Ahmad, UX Designer at VentureDive, shares the value of presenting reports as case studies holds:
“Case studies show how you think. As a UX Researcher or Designer, how you perceive problems and what framework you use to evaluate them matters a lot. Your case studies are supposed to show just that.”
9. Maze reports: For all-in-one research and reporting

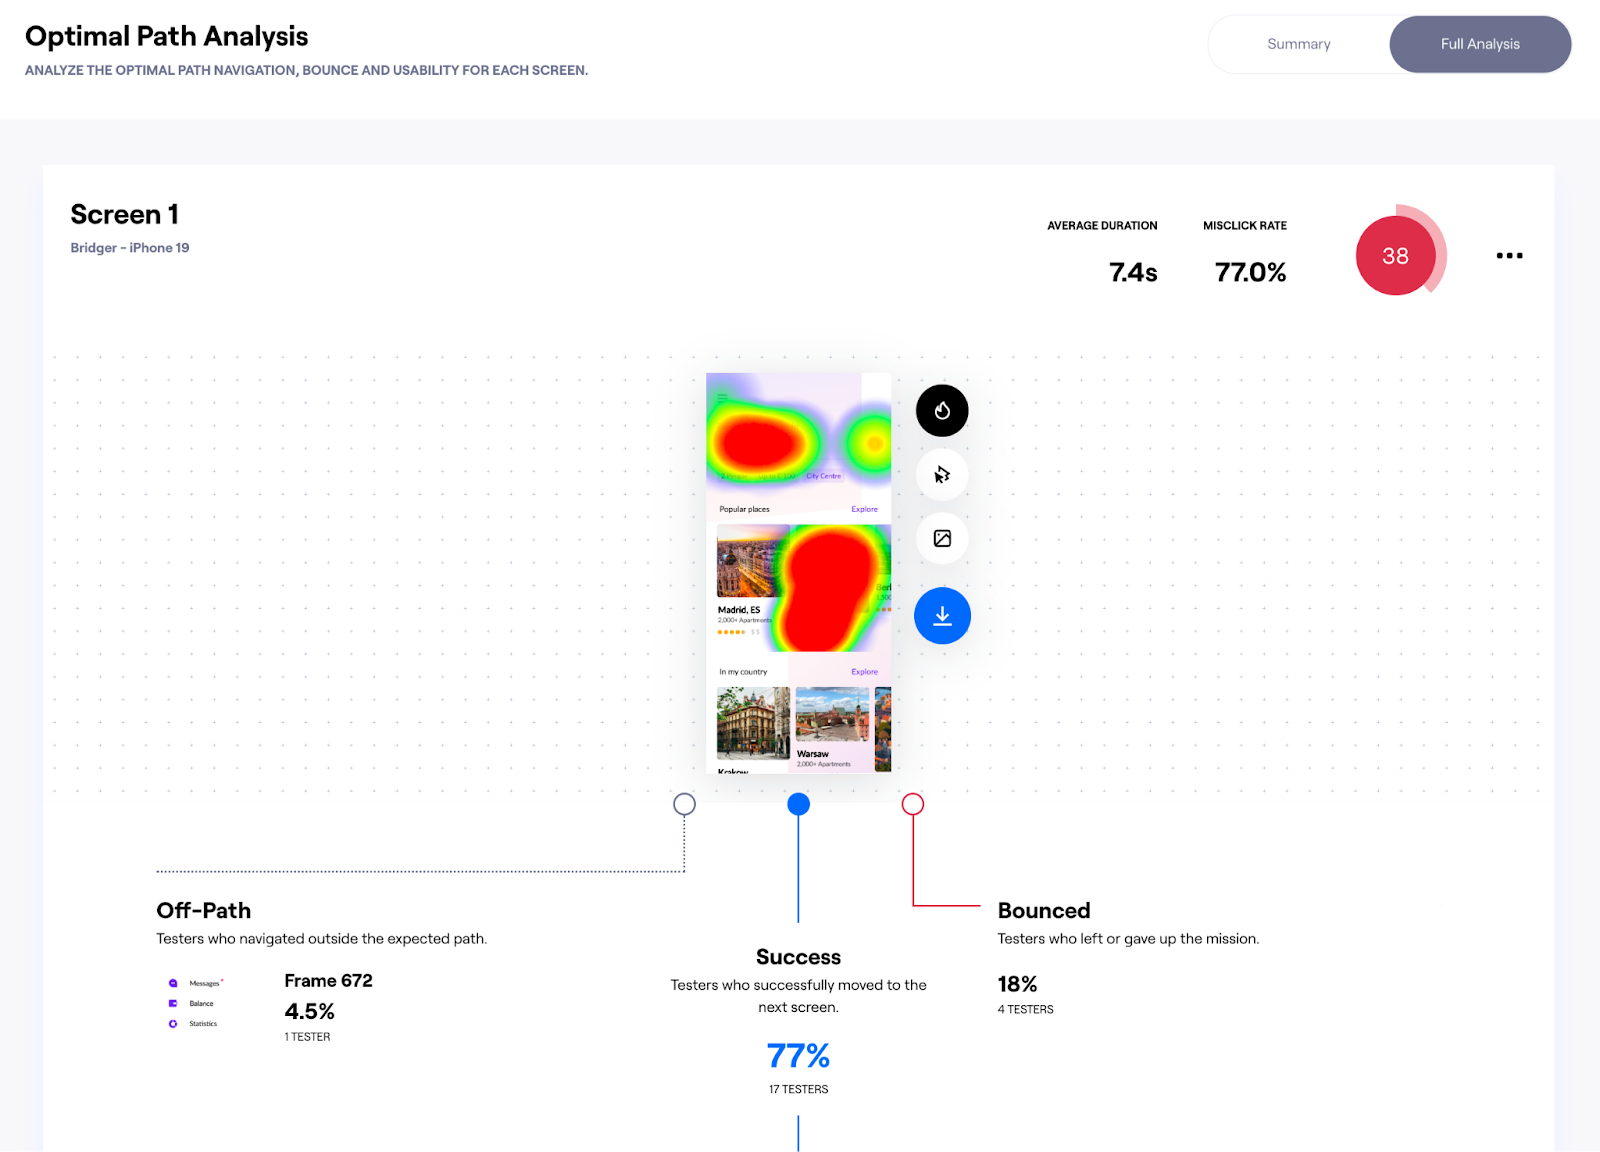
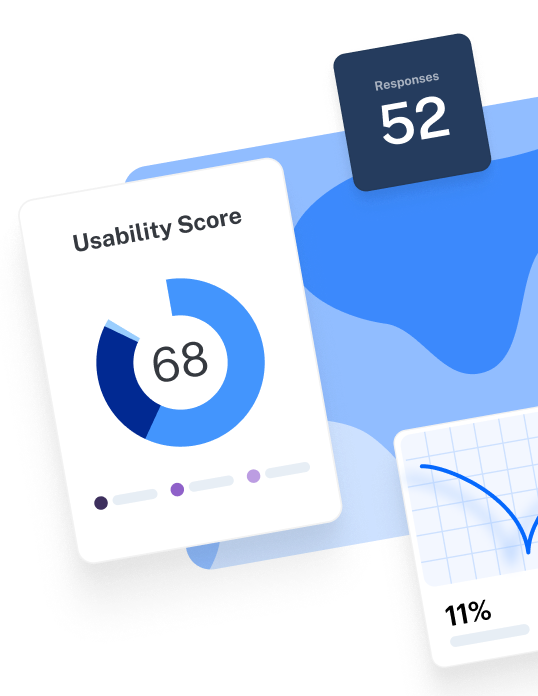
Automate your reporting with Maze. Maze automatically generates a report for each test you run, turning it into an easy-to-navigate dashboard. Add comments to generate conversation, highlight key responses and generate usability scores for your prototype testing.
If you’re working with moderated research, Maze AI can speed up the reporting process with automated sentiment tagging, project naming, and even generating summaries and identifying critical learnings from user interviews. So you can sit back, and let Maze take care of the data processing.
When you’re happy with your report, generate a custom link that you can share with your team, and further internal and external stakeholders.
Using Maze reports will enable you to share:
- Introduction and mission slides
- An analysis of each UX research method: From card sorting to live website testing
- In-depth breakdowns of research data
- Overviews of the report metrics: From misclicks to bounce rates and time-on-screen
- Heatmaps
- A usability score
These reports will also allow you to download CSV files of your data and customize filters and views to bring your stakeholders the numbers they need fast. Your team will be able to collaborate in a comments section and let AI identify key themes and takeaways if you’re struggling to spot them.
Overall, UX research tools with in-built reporting are a great way to translate and share all of your research into visual data sets that can be digested by the rest of the team in a few clicks.
7 UX research report templates
There are some fantastic research report templates to help get you started on your journey. Here are some of our favorites to help you better present those deliverables, key learnings, and everything in between.
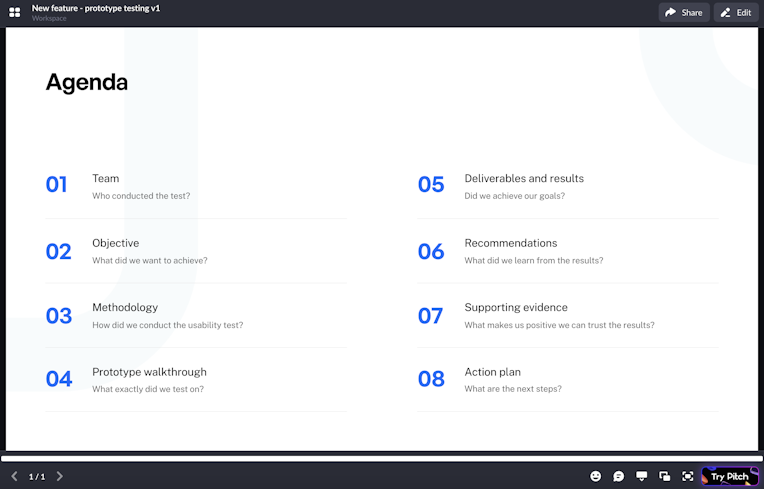
Maze: Usability testing report

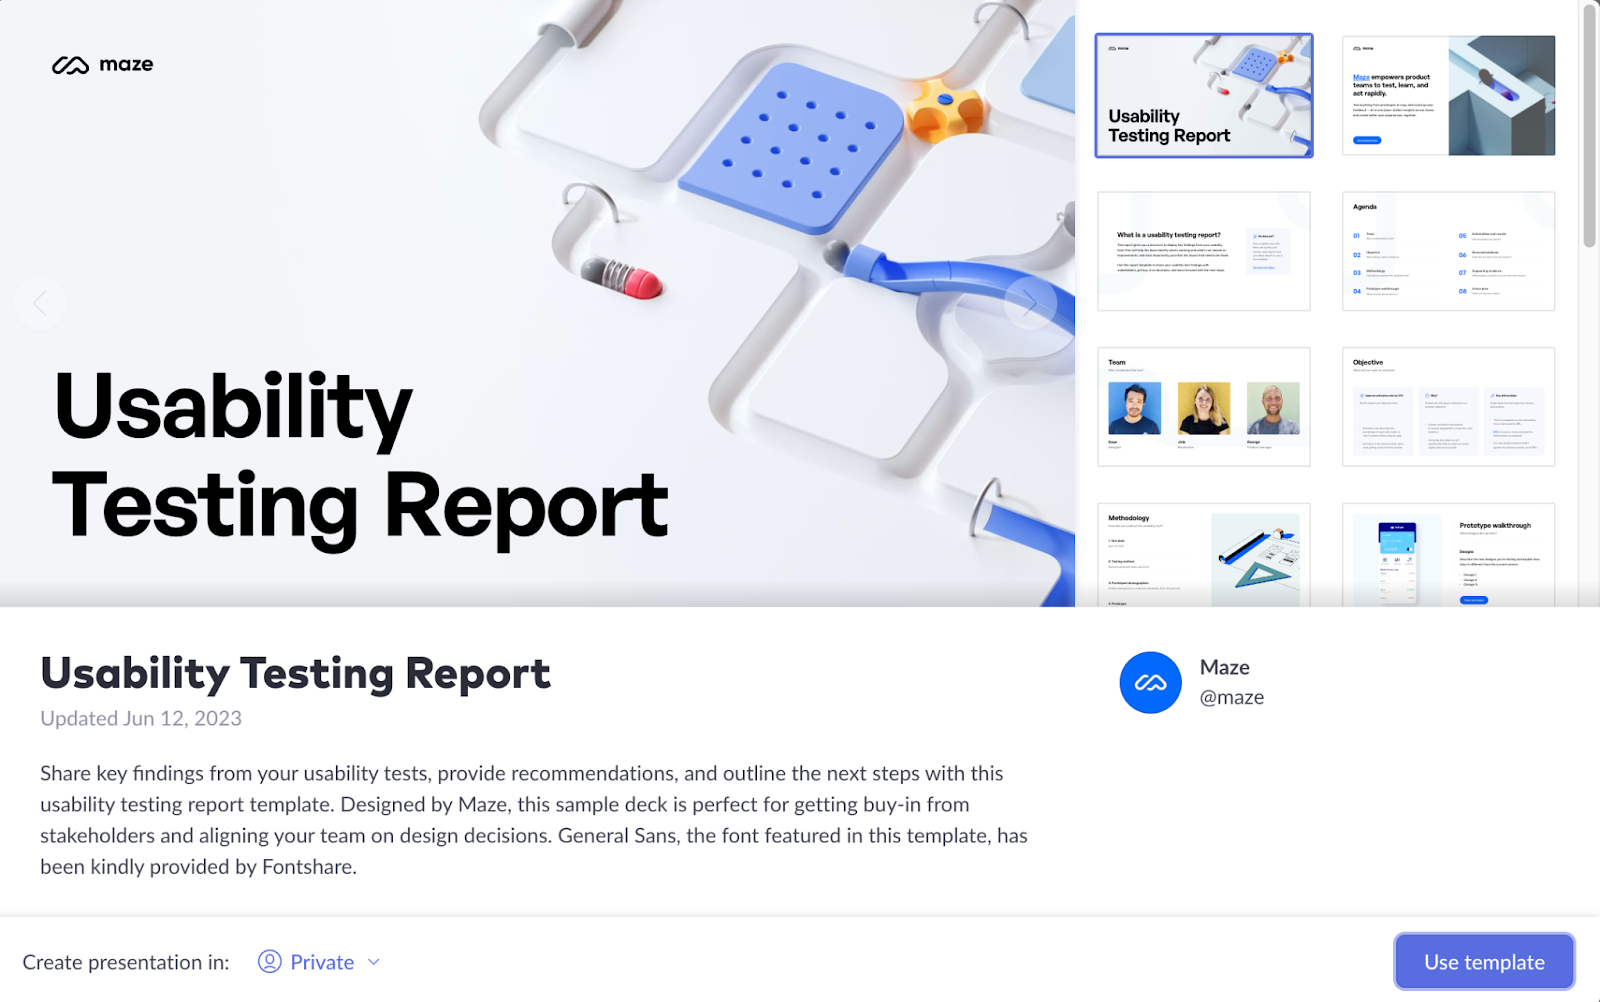
Hosted on Pitch, this report template is clear, simple, and follows a lot of the design and framework best practices shared in this chapter.
Aadil Khan: UXR report with examples

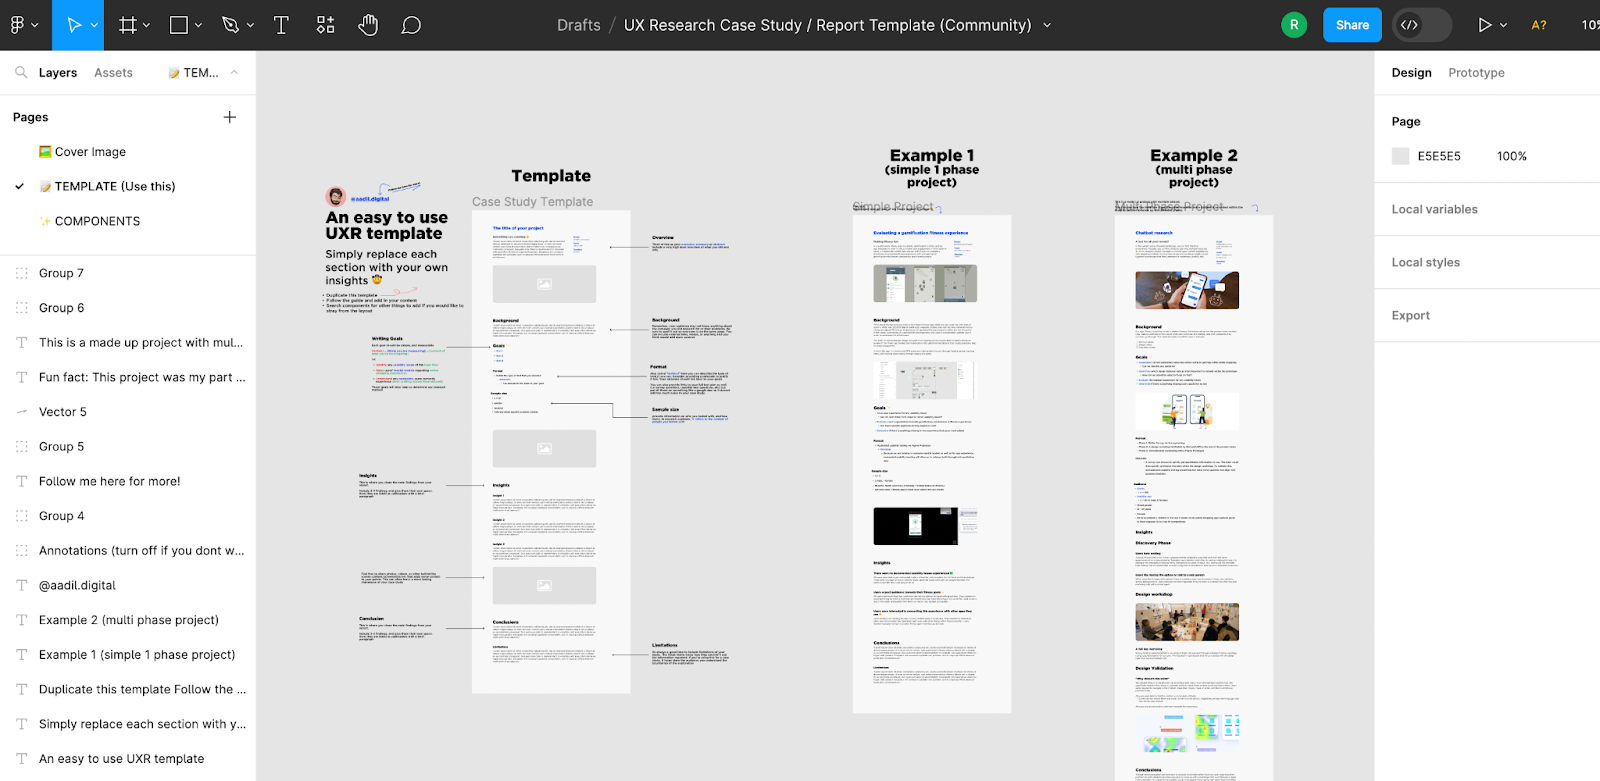
A straightforward report template is designed by Aadil Khan, UX Researcher at IBM, who says: “I made this template based on tons of mentoring calls I’ve been in with people looking to land UXR jobs where we discuss how to present UXR case studies during interviews and such. Oftentimes their case studies were too lengthy and lacked some sort of narrative structure to make it easier to present.”
EaTemp: Key findings report

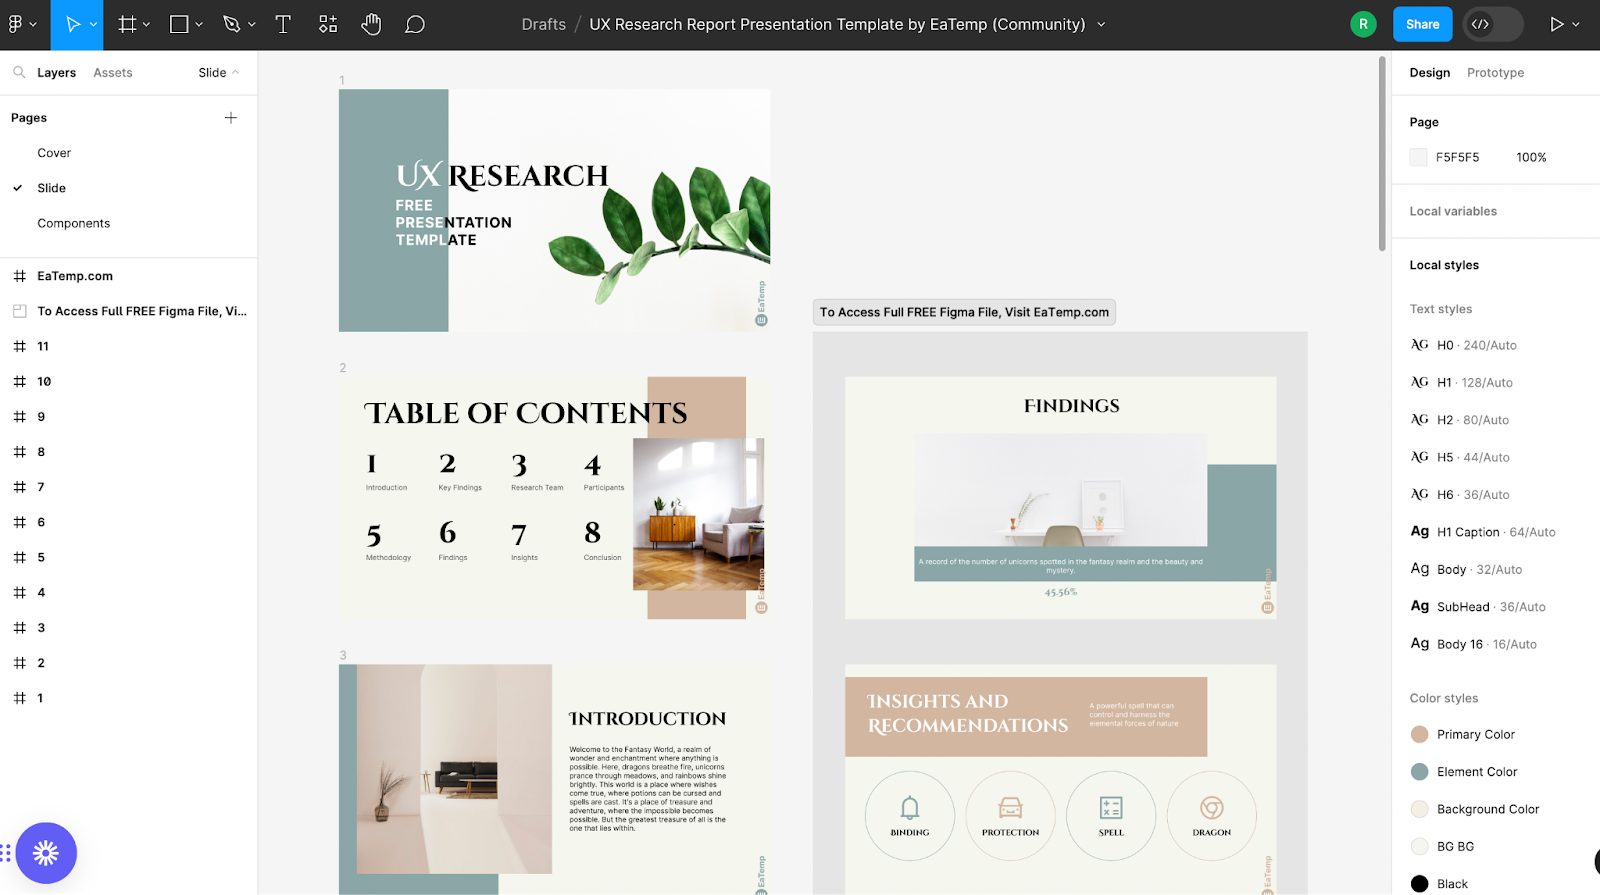
A beautifully-designed template hosted on Figma. Get access to personas, empathy maps, and card sorting. All colors, fonts, and shapes are customizable.
Miro: Research repository template
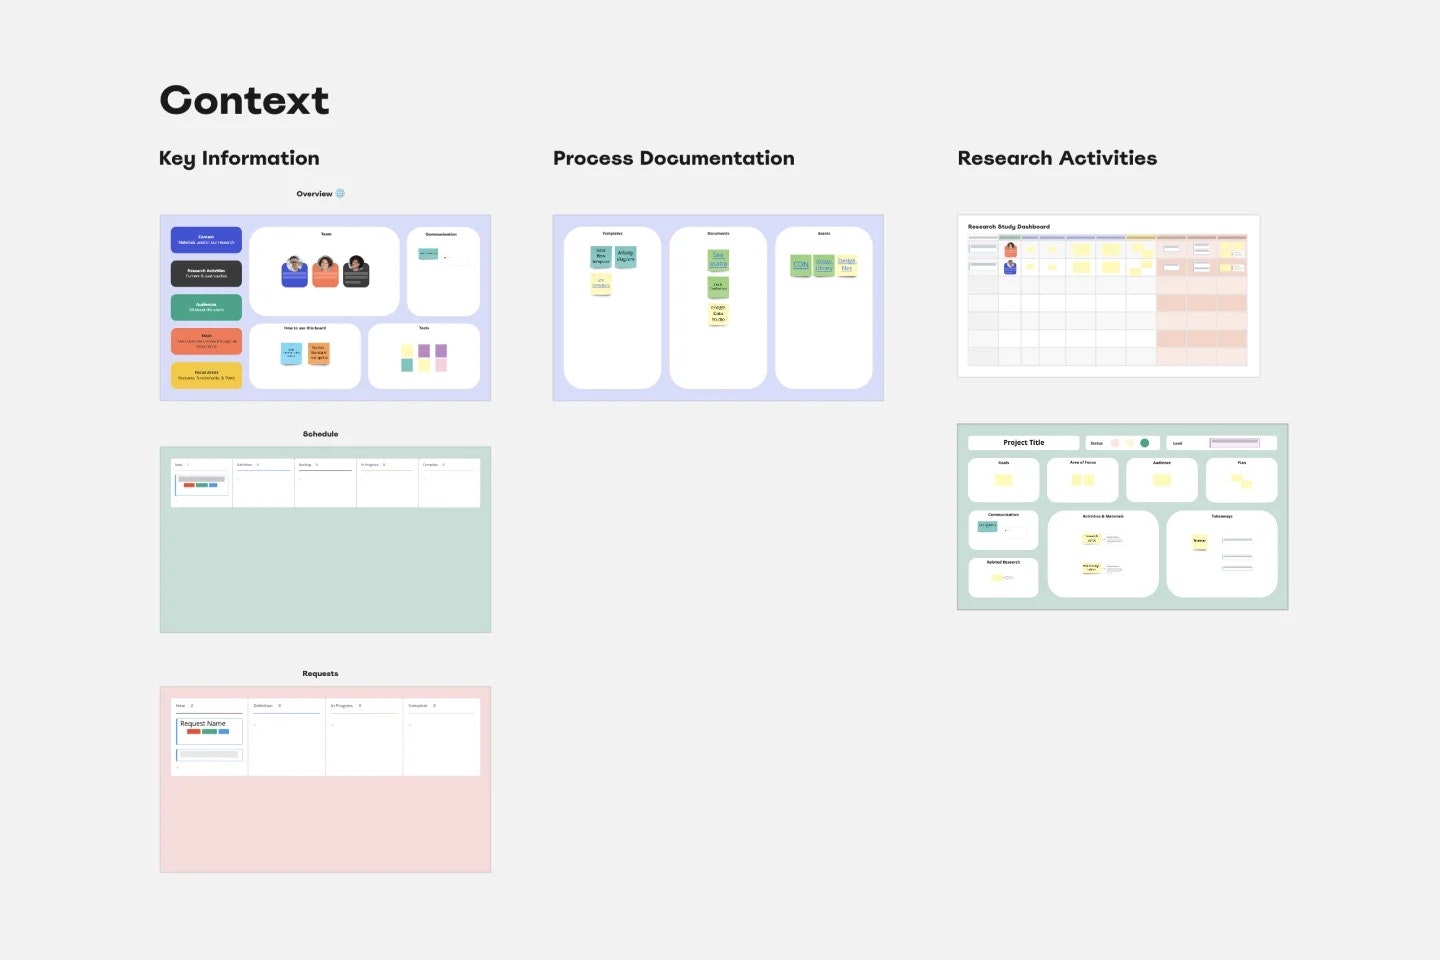
Build a centralized research hub on Miro. Connect your team in a few clicks and allow them to collaborate with this free template. Note: you’ll need to sign up for a (free) Miro account.
Furquan Ahmad: UX research report template

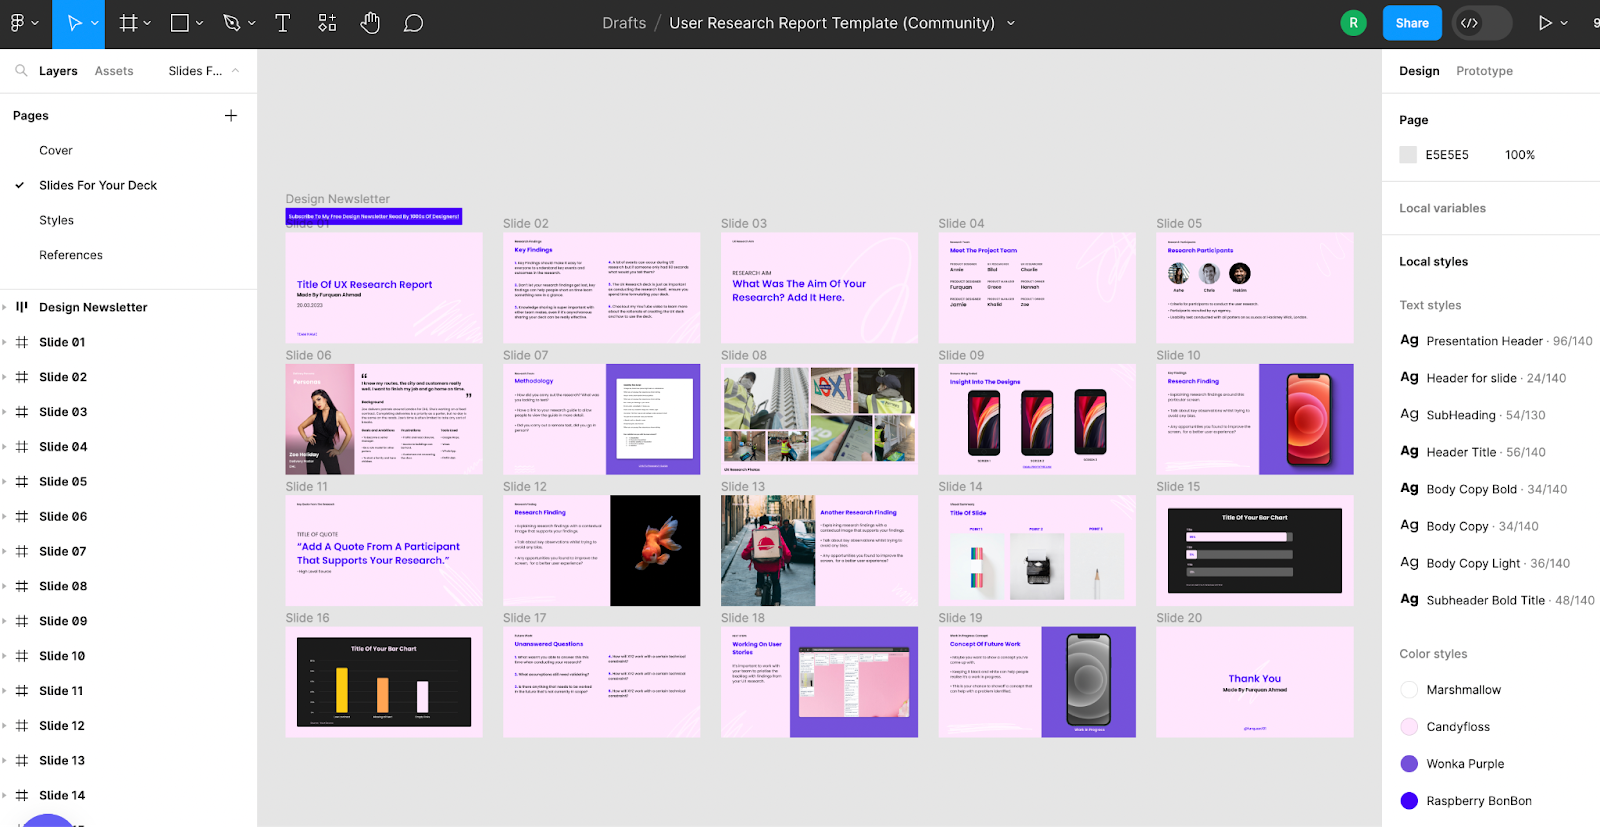
A sleek and vibrant presentation, this template was created by Furquan Ahmad, Product Designer at Meta, “to help people focus their energy and time on the insights they're providing rather than worry about what the presentation will look like. I'm always shocked at how many people have benefited from the community.”
Estefanía Montaña Buitrago: Atomic UX research canvas

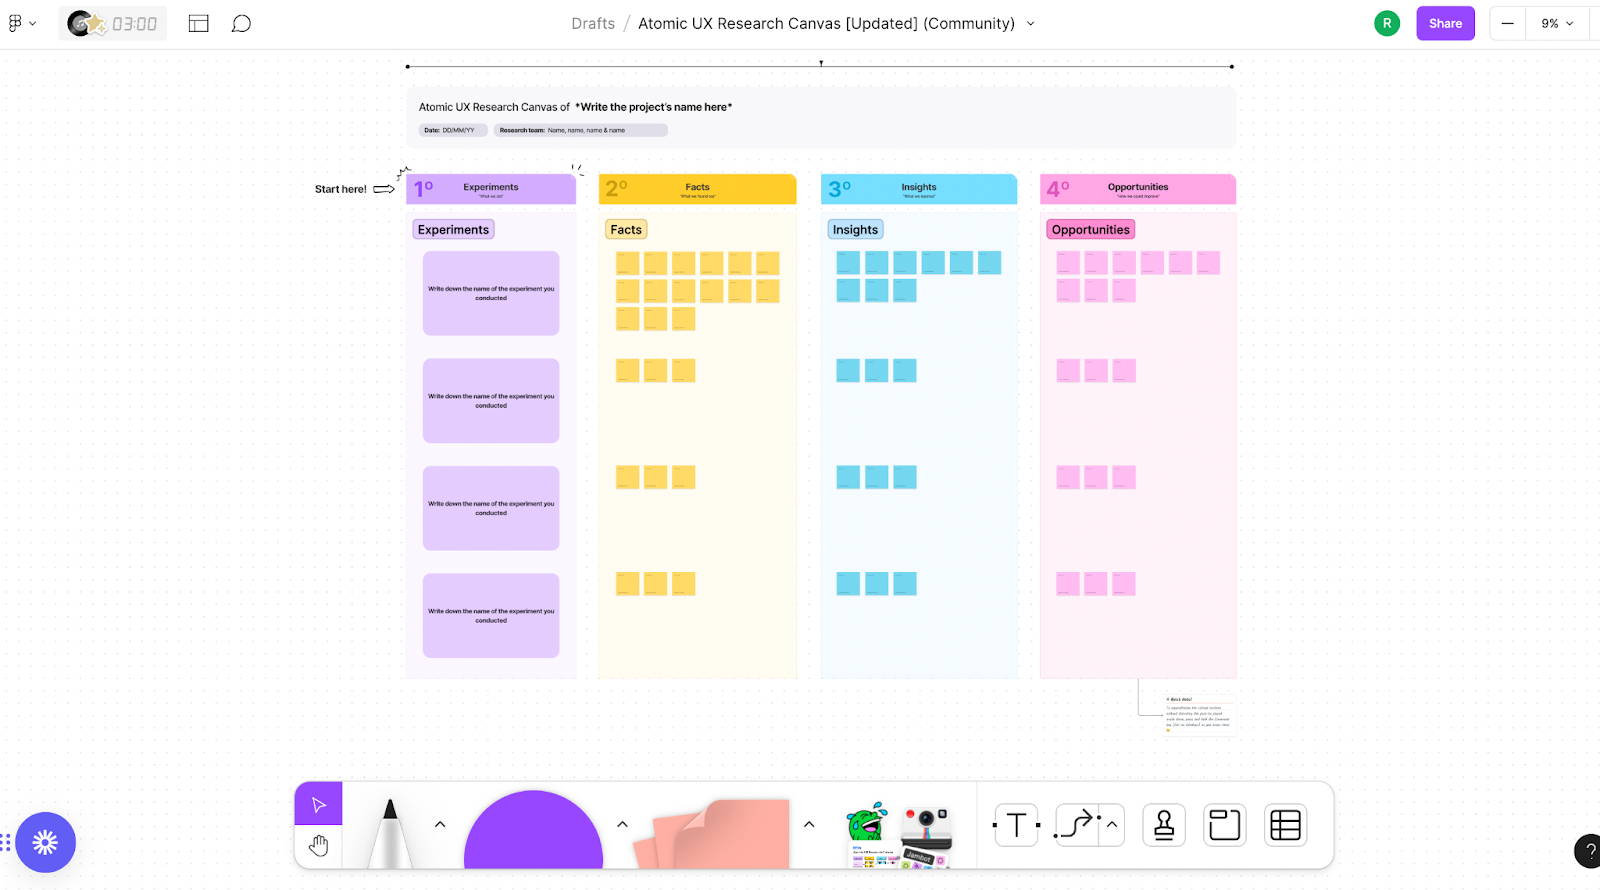
Beautifully designed on FigJam, this canvas by Estefanía Montaña Buitrago, UX Designer at Globant, has been used by over 7,000 people and now comes with several useful remixes too.
Muhammad Ahmad: UX research kit

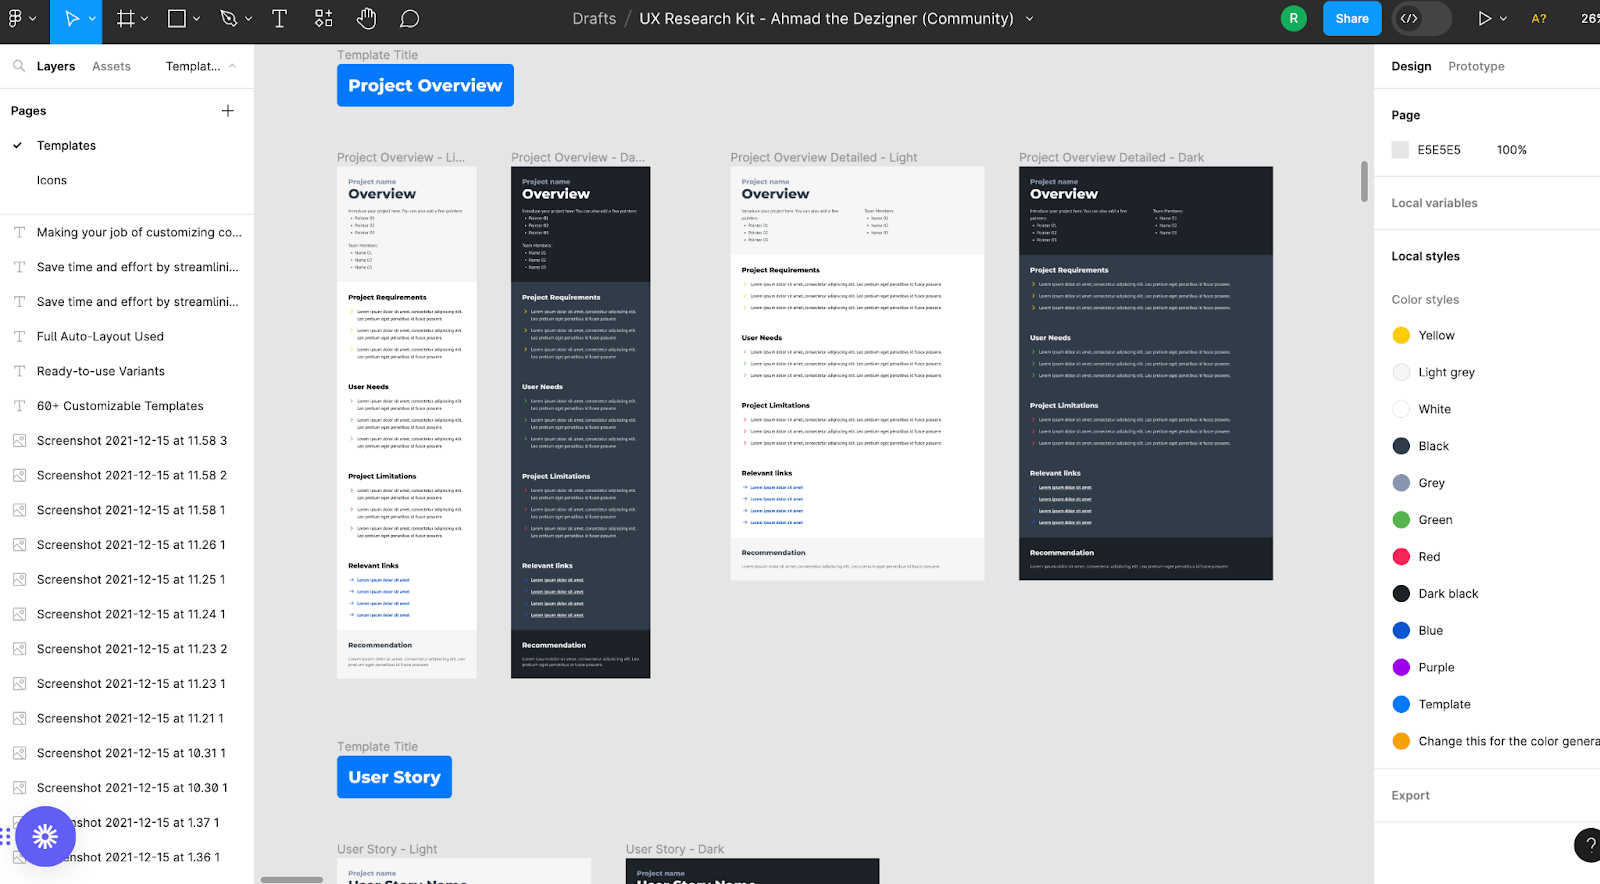
Muhammad Ahmad, UX Designer at VentureDive, shared this minimalistic template. Here you’ll get 60+ customizable templates in both light and dark modes. There’s a free version, or a (paid) premium version which may be worth the investment for you.
Best practices for writing an effective UX research report
The functionality of your research report will come down to how you write it. Sitting down and being faced with copious amounts of data can make UX reporting feel like a daunting task—here’s some techniques and tips to help you along the way.
Take a leaf from your UX design book with user-friendly copy
No matter the format, you want your UX report to be as accessible and skim-able as possible for your audience. It’s a good idea to mimic some of the same mentalities you would use in UX design.
Gestalt grouping principles are good to consider for UX report writing. Think similarity, proximity, and common-region for grouping relevant information.
Similarly, UI design principles such as the figure-ground and focal point will help direct your readers’ eyes to the most important information first, as well as make for a more accessible read.
Lastly, Gestalt’s continuity principle is a great one to apply to your UX report. Readers naturally follow patterns for easier flows in information, so if you’re including stylistic elements like bolding, italics, asides, indenting, or something else, ensure these run consistently throughout your report.
At the same time, think about the structure, layout, and formatting of your written report. Are you leaving enough negative space for your reader to process information? These are especially important for readers with dyslexia, but will generally lift your readability on the whole:
- Is all of your copy aligned left?
- Is your font choice clear, with a good amount of spacing between letters and words?
- Are you bolding important words and sentences rather than underlining them?
- Are you peppering your report with enough headings and subheadings?
Release oxytocin: Follow storytelling tactics
A Forbes article reported that “immersive storytelling releases the empathy-related chemical oxytocin in our brains.” If you’re not familiar with oxytocin, it’s known as a natural ‘feel-good’ chemical, promoting feelings of trust and attachment.
Why else do you think case studies are so effective? They rely on storytelling: they have characters, plots, beginnings, endings, peaks, and pits. User research reports that mimic storytelling threads and tactics are more likely to create sticky data points, as well as hold your readers’ attention throughout. This is why the PAS framework works so well, but whatever format your report takes, bear in mind a story-like structure with a beginning, middle, and end.
Ask your editor to edit your research presentation with the three Cs in mind
Clear, Concise, Compelling. These core principles exist everywhere the written word does, but it can be hard to spot them when editing your own work. Just because something is clear, concise, and compelling for you, doesn’t mean it is for someone else—ask a colleague to read your report (or, better yet—a content editor).
Failing that, if you don’t have access to an editor or are in a time crunch, here are some tools to help you edit your own work.
- Grammarly: Good for catching those little typos and grammatical errors
- Hemingway Editor: Gives a readability score and helps to simplify sentences
Consider your reader, and rethink the jargon
Tailoring your report to meet the needs and knowledge level of each stakeholder is a balancing act. Many will tell you to avoid jargon, acronyms, and technical language at all costs. But, that’s not always the case. Sometimes, using industry jargon is the most direct way of getting your point across, and if you know your reader understands it, go for it.
However, keep in mind that if your report is going to other teams: sales, C-suite, finance, etc, then you may need to find alternative terms that aren’t department-specific—or provide a glossary or acronym dictionary within the report.
Muhammad shares more: “Typically UX folks (or even product folks) are not that well-equipped with research terminologies. So giving them the summary of the research in plain language is the approach that works best for me.”
Wrapping up how to present user research findings
There you have it, a complete guide on how you can write and present your user experience research in a way that everyone can benefit from.
Remember, be conscious of your audience, your format, and your language. Different stakeholders and team cultures require different reporting styles. It’s up to you to curate the information into a report that delivers the insights you’ve uncovered.


Frequently asked questions
What is a UX research report and why is it important?
What is a UX research report and why is it important?
A UX research report is a summary of your research goals, methods, findings, and recommendations. It is important because it turns raw data into clear guidance for product decisions and keeps teams aligned around real user needs. It's also curcial for getting stakeholder buy-in across your organization.
How do you write a UX research report that stakeholders will read?
How do you write a UX research report that stakeholders will read?
Lead with a short summary of key findings and recommendations, then add the context people need—such as why you conducted the study and the methods you used. Keep language simple, use clear headings and visuals, and tailor depth to your audience instead of over-explaining methods.
What are common mistakes to avoid in UX research reports?
What are common mistakes to avoid in UX research reports?
Common mistakes include focusing too much on methodology, burying the main insights, using confusing jargon, and not linking findings to concrete next steps. Overlong, static reports that never get updated or reused are another red flag.
What tools can help create and share UX research reports?
What tools can help create and share UX research reports?
Teams often use slides, docs, and knowledge bases to package and store reports, plus Slack or Loom for highlights. UX research platforms like Maze turn studies into shareable reports with automated summaries, metrics, and links you can distribute in a few clicks.