



















TL;DR
Thematic analysis helps UX researchers turn messy qualitative data from interviews, surveys, usability tests, and recordings into clear themes your team can act on.
The process is simple:
- Review data
- Create codes
- Group related ideas into themes
- Check those themes against the original responses
- Report the findings
It’s especially useful when you need to understand recurring user needs, pain points, and behaviors across a dataset.
With Maze, teams can speed up this process by transcribing sessions, identifying themes and key findings, and turning research into shareable reports.
User interviews, open-ended survey responses, usability test notes, and support feedback provide UX researchers with qualitative data. But without a clear way to analyze this data, teams can mistakenly identify one memorable quote as a pattern, overlook common issues across multiple users, or share findings that are too vague to act upon.
Thematic analysis gives you a structured way to organize qualitative data, code recurring ideas, and turn raw feedback into themes. In this article, we walk through the five crucial steps for performing thematic analysis and share our top tips for success.
What is thematic analysis?
Thematic analysis is a qualitative data analysis method that turns raw research data into patterns that inform UX and product decisions.
It helps UX researchers analyze qualitative data from user interviews, surveys, focus groups, and other qualitative research methods.
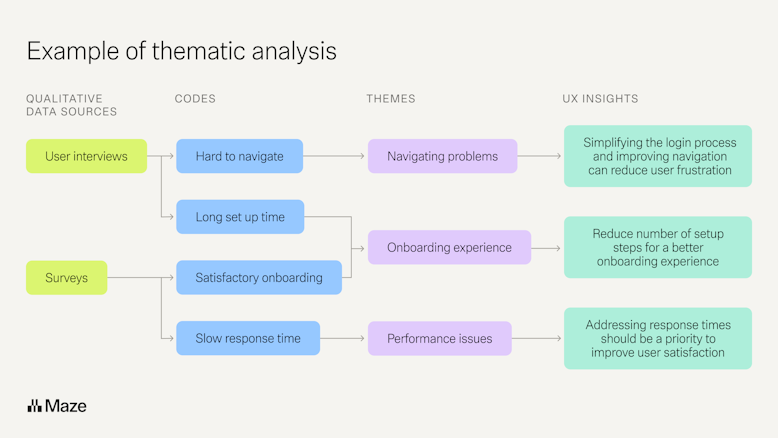
The process involves reviewing your dataset, creating initial codes, and grouping related observations into themes. These themes capture recurring patterns in what users say, do, need, or struggle with.
- Codes are tags or labels used to identify and categorize common topics of interest
- Themes are made from a combination of codes, helping you connect specific user experiences to larger product or usability issues
This research analysis technique is particularly useful when reviewing large amounts of qualitative data. For example, let’s consider you’re building a project management tool and have interviewed users to gather insights. You’re left with hundreds of hours of interview transcripts.
Using thematic analysis, you might identify:
- Codes like 'design,' 'interface,' or ‘integrations’
- These combine into potential themes like ‘the need for an intuitive platform’ and ‘the importance of seamless integrations'
When you analyze interview transcripts or survey responses thematically, you can zoom in on what truly matters for your users, like intuitive design or easy integrations. You can assess all your UX research data as a whole, and convert complex, diverse results into a set of curated, actionable insights your team can use during product planning, prioritization, or design decisions.

When should I use thematic analysis?
Thematic analysis comes from the field of psychology and social sciences, where researchers actively use this analytical technique to study qualitative data. Given its flexibility and efficiency to identify patterns and find insights from a massive dataset, it’s been widely adopted by UX researchers.
Here are a few common use cases of thematic analysis in UX research:
Evaluate large data sets
Once you’ve collected data from user surveys and interviews, you can systematically organize all the information and extract meaningful insights using codes and themes. It can help you find patterns and document common themes in your data. It’s also useful for diary research spanning over an extended period.
For example, let's say you rolled out a survey to collect feedback from your entire user base and received over 2,000 detailed responses.
With thematic analysis, you can evaluate these responses and create coded data to fast-track your analysis. For example, allowing you to draw conclusions like 'helpful user interface,' 'seamless onboarding,' and 'inefficient self-serve support,' being priorities for users.
Haley Stracher, CEO and Design Director at Iris Design Collaborative uses thematic analysis to identify large-scale issues or analyze large datasets, and warns against using it for individual feedback:
Thematic analysis is particularly useful when you’re identifying major problems. For example, if the drop-off point in a section of wireframes is high, analyzing the pattern of why using thematic analysis is really critical. However, when gathering individual experiences or generalized feedback, thematic analysis can be misleading and difficult to create a patterned analysis from, so you’d be better suited to other kinds of analysis.


Haley Stracher
CEO and Design Director at Iris Design Collaborative
Share
Study multi-layered user experiences
Thematic analysis also works well when you're evaluating user behavior across complex user journeys, think-aloud usability tests for complex products, or research workflows.
For example, let's say you conducted usability tests for your new app and received over 50 session recordings. After transcribing the sessions, you can use data coding to tag moments where users feel confused, hesitate, complete a task successfully, or react positively to a feature.
From there, thematic analysis helps you move beyond individual clips and identify broader patterns. You might find that users understand the product’s core value quickly but struggle when setting up integrations or choosing the right plan.



Contextualize quantitative findings
Thematic analysis is also useful in mixed methods research, especially when quantitative research shows what happened but not why.
It helps you find users’ first-hand perspectives, which is a great way to get a more complete picture beyond what can be quantified.
For example, imagine your free trial-to-conversion rate dropped by 8% this month.
You interviewed all free users who didn't convert into paying customers, then analyzed these interviews thematically to find pain points or concerns common for several users. By identifying these themes, you find real context behind performance metrics: giving you deeper insight to inform product decisions, and tangible data to share with stakeholders when looking to solve these blockers but needing buy-in.
Compare responses from a diverse group
Thematic analysis is particularly helpful for studying diverse user groups and their preferences. Thematic findings can highlight ways to tailor your product experience to specific user needs across different regions.
For example, if you want to survey users from different markets like the USA, UK, Singapore, and Japan for your time management app, you can use thematic analysis to compare themes across users in these markets. You can analyze qualitative data to identify lifestyle differences, preferences, and work management.
How does thematic analysis compare to other qualitative methods?
If you’re new to qualitative research, thematic analysis is a great starting point. It can help you build your analytical skills and systemize the data interpretation process. However, it’s important to understand how this technique differs from other qualitative research methods:
- Thematic analysis doesn’t restrict researchers with rigid theoretical frameworks: Researchers across several disciplines or industries can use this method for multiple use cases, research question types, and data types. Other research methods are tied to specific approaches, like grounded theory, which relies on theory generation for analyzing the data.
- Thematic analysis focuses on the data of experience as a whole: This method enables researchers to identify patterns within the data and create themes reflective of users' actual experiences. In comparison, other qualitative methods focus on specific aspects of the participants. For example, narrative analysis focuses on storytelling and discourse analysis on language.
- Thematic analysis is suited to large amounts of data: While researchers are free to interpret data semantically and latently in thematic analysis, other methods are more structured and limited in their analysis approach. Analyzing data using more specific approaches—such as content analysis, for example—is time-consuming and impractical for vast amounts of data.
Thematic analysis provides a good understanding of the overall thoughts, feelings, and pain points of users, while other qualitative research methods tend to be much more rigid, theory-based approaches that leave little room for subjectivity.
When not to use thematic analysis
You do not need thematic analysis for every research methodology. Avoid using it when:
- Your dataset is too small to show patterns: If you only have a handful of participants (e.g., fewer than 5–6 per user group), you may not have enough variation to identify reliable patterns across users. In that case, treat each session as an individual case study instead of trying to force themes.
- Your study is primarily quantitative: If you need to measure usability metrics like task success, compare conversion rates, calculate satisfaction scores, or estimate how common an issue is across your user base, use quantitative research methods first.
- You need to count topics rather than interpret meaning: If your goal is to track how often users mention a specific word, feature, or issue, content analysis may be a better fit. Thematic analysis is better for understanding patterns in what users mean, not just how often something appears.
What are the main approaches for thematic analysis?
You can apply the thematic analysis method in two main ways: inductive and deductive.
The main difference between the inductive and deductive approaches is where your themes come from. Here’s a quick glance at both approaches side by side:
Inductive analysis | Deductive analysis | |
|---|---|---|
Starting point | Data‑driven; themes emerge from the dataset as you code and review it | Theory‑ or framework‑driven; themes are guided by prior ideas, models, or hypotheses |
Direction | Bottom‑up. You read your transcripts or notes, code what you see, and then decide which themes matter based on patterns in the dataset. | Top‑down. You arrive with expected themes or hypotheses, often based on earlier research, product strategy, or a framework you already use. |
Typical UX use case | Exploring a new problem space, discovering unknown needs or pain points, mapping user language. | Testing assumptions, validating product hypotheses, or checking data against known themes (e.g. product pillars, JTBD) |
Advantages | Flexible and open; good for discovery and identifying unexpected insights | Efficient when you already have a framework; easier to compare across studies or over a period of time |
Risks | Can drift or feel unfocused without clear research questions or boundaries | Can ‘force’ data into preconceived boxes and miss novel or contradictory findings |
The right approach depends on whether you want to explore the data openly or analyze it against an existing idea, research question, or hypothesis.
💡 Quick decision guide: Use inductive analysis when you’re exploring a new problem space and want themes to emerge from the data. Use deductive analysis when you already have a hypothesis, framework, or set of expected themes and want to test them against user data.
Let’s break down these different approaches.
The inductive approach
The inductive approach to thematic analysis is about discovering ideas and creating themes from the data, rather than forcing it into a predefined coding frame or existing theory.
You’re not testing a specific hypothesis; instead, you stay close to what the participants say and build your codes and themes from the ground up. This approach then draws on the researchers’ awareness of the field—how well they know and understand the research subject—to complete the qualitative study process.
Using our project management example, an inductive analysis might look like this:
It has four main steps. Using our project management example, this could look like:
- Data collection: Send surveys to 100 project managers and run follow-up interviews
- Initial observation: Find repeat references to 'customization options,' 'ease of use,' 'collaboration'
- Pattern identification: Identify emerging patterns like ‘frustration over tools with a steep learning curve’
- Theory development: Chalk out the theory that a good project management tool should balance simplicity and customization with good integration capabilities
Reflexive thematic analysis (RTA)
Within the inductive approach, one common method is reflexive thematic analysis.
Reflexive thematic analysis emphasizes the researcher’s active role in constructing themes rather than treating them as simply ‘discovered’ in the data.
For UX researchers, this means you:
- Spend time reading and re-reading transcripts or notes to build familiarity
- Code flexibly, allowing new codes to emerge as you encounter unexpected user language or behaviors
- Regularly step back to ask whether your themes still reflect the data or whether your own biases might be narrowing your view
The deductive approach
With the deductive approach, you start with existing ideas. Researchers use thematic analysis to test known theories and validate specific hypotheses, rather than to explore a completely open problem space. The data is collected and analyzed with these prior expectations in mind, often based on earlier UX research or product assumptions.
When we spoke with Haley Stracher, CEO and Design Director at Iris Design Collaborative, she highlighted the deductive approach as her go-to when conducting thematic analysis.
“Typically, I’ll have a hypothesis on a couple of themes I see in my UX research, which is then either validated or disproven. So, I start the process with a hypothesis instead of doing thematic analysis from scratch.”
Pro tip ✨
You can use deductive analysis alone or alongside inductive analysis, to further delve into themes you’ve uncovered and early hypotheses.
When conducting deductive thematic analysis, your existing theories will come from previous user research and existing assumptions about your users.
Start with these theories to conduct deductive analysis in four steps:
- Theory development: Develop theories like ‘users need feature A to fulfill use case B’
- Hypothesis formulation: Create a hypothesis e.g. ‘feature A will increase retention by X%’
- Data collection: Conduct user interviews and ask research questions aligned with the hypothesis
- Qualitative data analysis: Analyze the data to confirm or nullify the hypothesis and develop new themes based on patterns
Codebook thematic analysis
Within deductive work, one common style is codebook thematic analysis.
In this approach, you work with a structured codebook: a set of predefined codes with clear definitions, examples, and rules for when each code should be used. The codebook gives researchers a shared coding structure, so they’re not interpreting the same piece of feedback in entirely different ways.
Richard Boyatzis helped shape how researchers think about code development in thematic analysis. His 1998 book, 'Transforming Qualitative Information', is often referenced for one simple reason: good themes start with good codes.
That means each code must clearly define itself, provide enough detail to guide the researcher, and maintain enough separation from other codes to avoid messy overlap.
Once the codebook is created, new data is then coded against it. You assign each data excerpt to one or more pre-existing codes and may refine or add codes as you go if you identify gaps.
This makes codebook thematic analysis useful when:
- You’re working in a team and need shared definitions for consistent coding
- You want to compare new data against an established framework or prior wave of research
- You have to report against specific themes (for example, a known set of product pillars)
In practice, that often means building a codebook from earlier inductive work, then using it deductively to tag new feedback at scale and see how well it fits your existing understanding.
What’s the difference between inductive and deductive analysis?
The main difference between the inductive and deductive approaches is that the latter tests existing ideas and theories, while the former is about outlining the scope of your research design from scratch.
In both inductive and deductive analysis, you can approach data using:
- The semantic approach: You interpret all insights at face value and don’t consider the secondary or implicit meaning of the data
- The latent approach: You look at the underlying interpretation of the data instead of considering only the surface-level insights
The semantic and latent approaches are two different ways of approaching your data and can be used in both inductive and deductive thematic data analysis.
How to perform thematic analysis in 5 steps

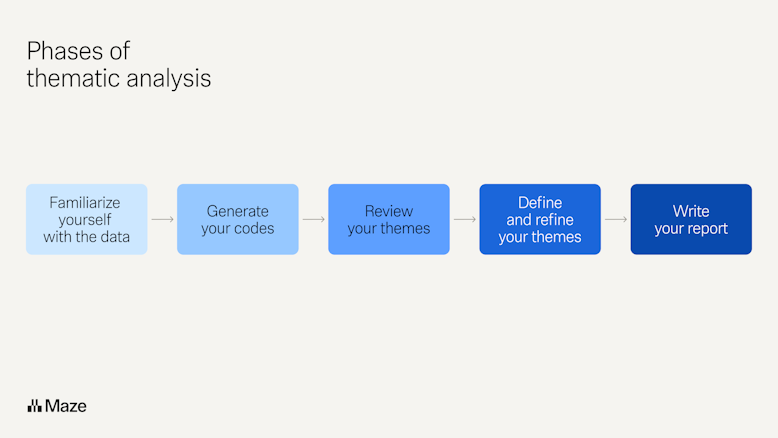
Virginia Braun and Victoria Clarke first outlined a six-phase process for performing thematic analysis in their 2006 study titled ‘Using thematic analysis in psychology’.
In this guide, we use a condensed five-step version that maps directly onto their framework but is tailored to how UX researchers work day to day.
Let’s take a look at these steps and how they apply to UX research.
1. Familiarize yourself with the data
This is the foundation of everything that follows. If you jump straight into coding without first reading through your data, you risk misinterpreting responses or building themes on a shallow understanding of what participants said.
Here’s when you listen to all the interview sessions, read the transcripts, or review the survey responses. Remember that you don’t have to document anything at this point, but feel free to make a few notes about recurring themes or obvious patterns visible in the data. You’re essentially reviewing all the data at once with informed curiosity rather than an analytical lens.
2. Generate initial codes
Now that you know your data well, it’s time to start organizing it. You work through your transcripts or responses and assign short labels to any segment of data that seems relevant to your research question or is worth examining further.
Codes are not themes yet. You’re just tagging raw material before you start assembling it into big ideas.
But not all codes work the same way. As we’ve seen before, a descriptive code captures what is happening. It labels the content of what a participant said without adding interpretation.
An interpretive code captures what the data means and reflects your reading of the underlying idea or tension.
Here's how that looks in practice:
As you code, watch out for two common mistakes:
- Over-coding happens when you tag too many small, specific ideas separately, creating hundreds of fragments that are hard to group later
- Under-coding happens when your labels are too broad, causing nuance and important distinctions to get lost
Aim for codes that are specific enough to be meaningful but broad enough that you'll see them repeat across participants.
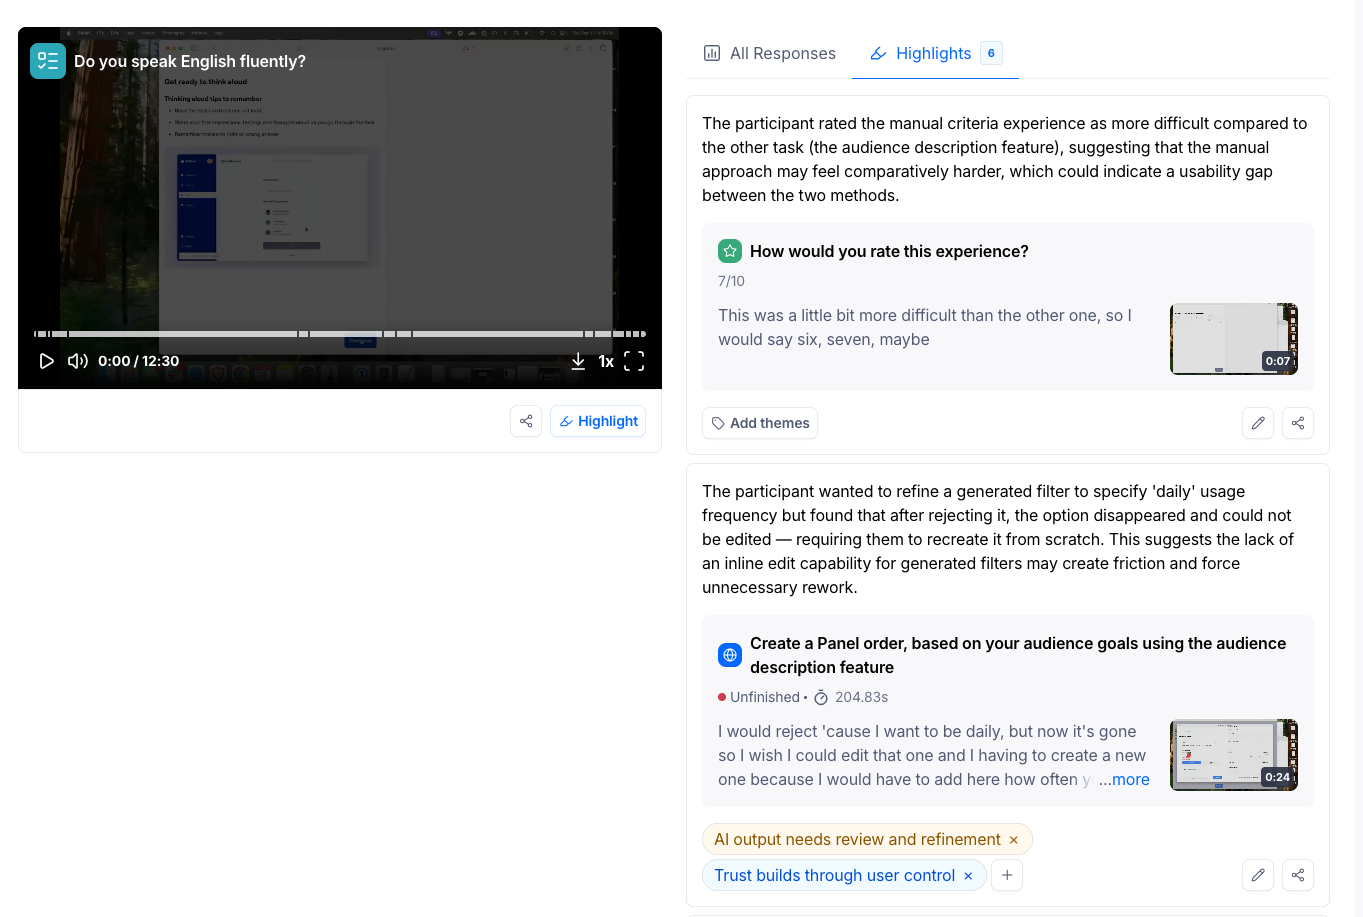
In Maze, you can highlight important moments directly in your transcripts or clips and group those highlights into themes, then use AI summaries to quickly see what those patterns mean for your product decisions.

3. Search for themes
With your codes in place, you now have a set of labeled data extracts scattered across all your transcripts and responses. This is where you step back from the individual codes and ask a bigger question: what patterns of meaning are forming across them?
Where a code tags a specific moment, for example, ‘navigation difficulty,’ a theme captures a recurring pattern that connects multiple codes into a meaningful concept, such as ‘users lose confidence when they can't find what they need.’
A theme is not just ‘a thing people mentioned a lot.' It connects several related codes into a bigger idea that explains why that thing matters and what it reveals about your users’ experiences.
For example, if multiple participants talk about getting lost in navigation, the theme is not simply that “navigation is confusing.” A richer theme might be “users lose confidence and abandon tasks when they cannot reliably find key actions,” which links what happened, how they felt, and the impact on behavior.
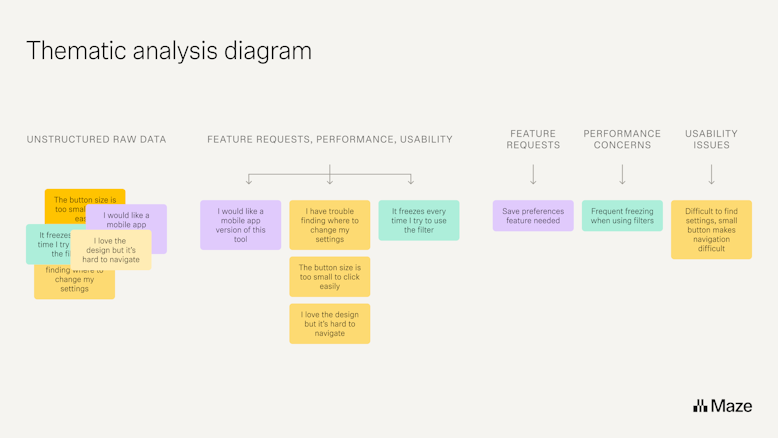
Most themes are built from several codes that share an underlying idea. Your job here is to group, cluster, and connect.
💡 Not every code will become its own theme. Sometimes two or three codes belong together under one bigger idea. Don't force a theme out of a code that only appears once or twice.
One of the most effective ways to start grouping is through an affinity diagram. You take each code and start grouping them by similarity—on sticky notes, cards, or a digital tool like FigJam or Miro. Once clusters start forming, give each one a working theme name that captures the shared idea.

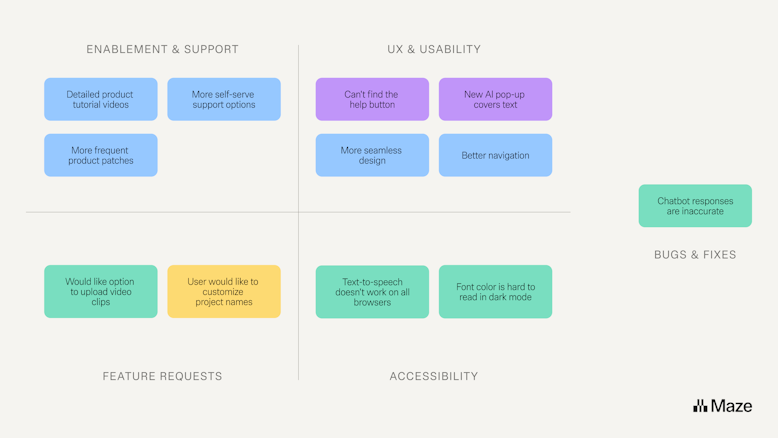
As clusters take shape, you may notice that some themes are broad enough to contain sub-themes. These are smaller, more specific patterns that sit within a larger idea and can add usefulness to your final analysis.
Pay attention to outliers too. These are data points that don't fit neatly into any cluster. They are easy to discard, but occasionally an outlier signals an important idea that just isn't as common yet. It's worth asking whether it points to something bigger before setting it aside. Sub-themes can sometimes grow from exactly these kinds of observations.

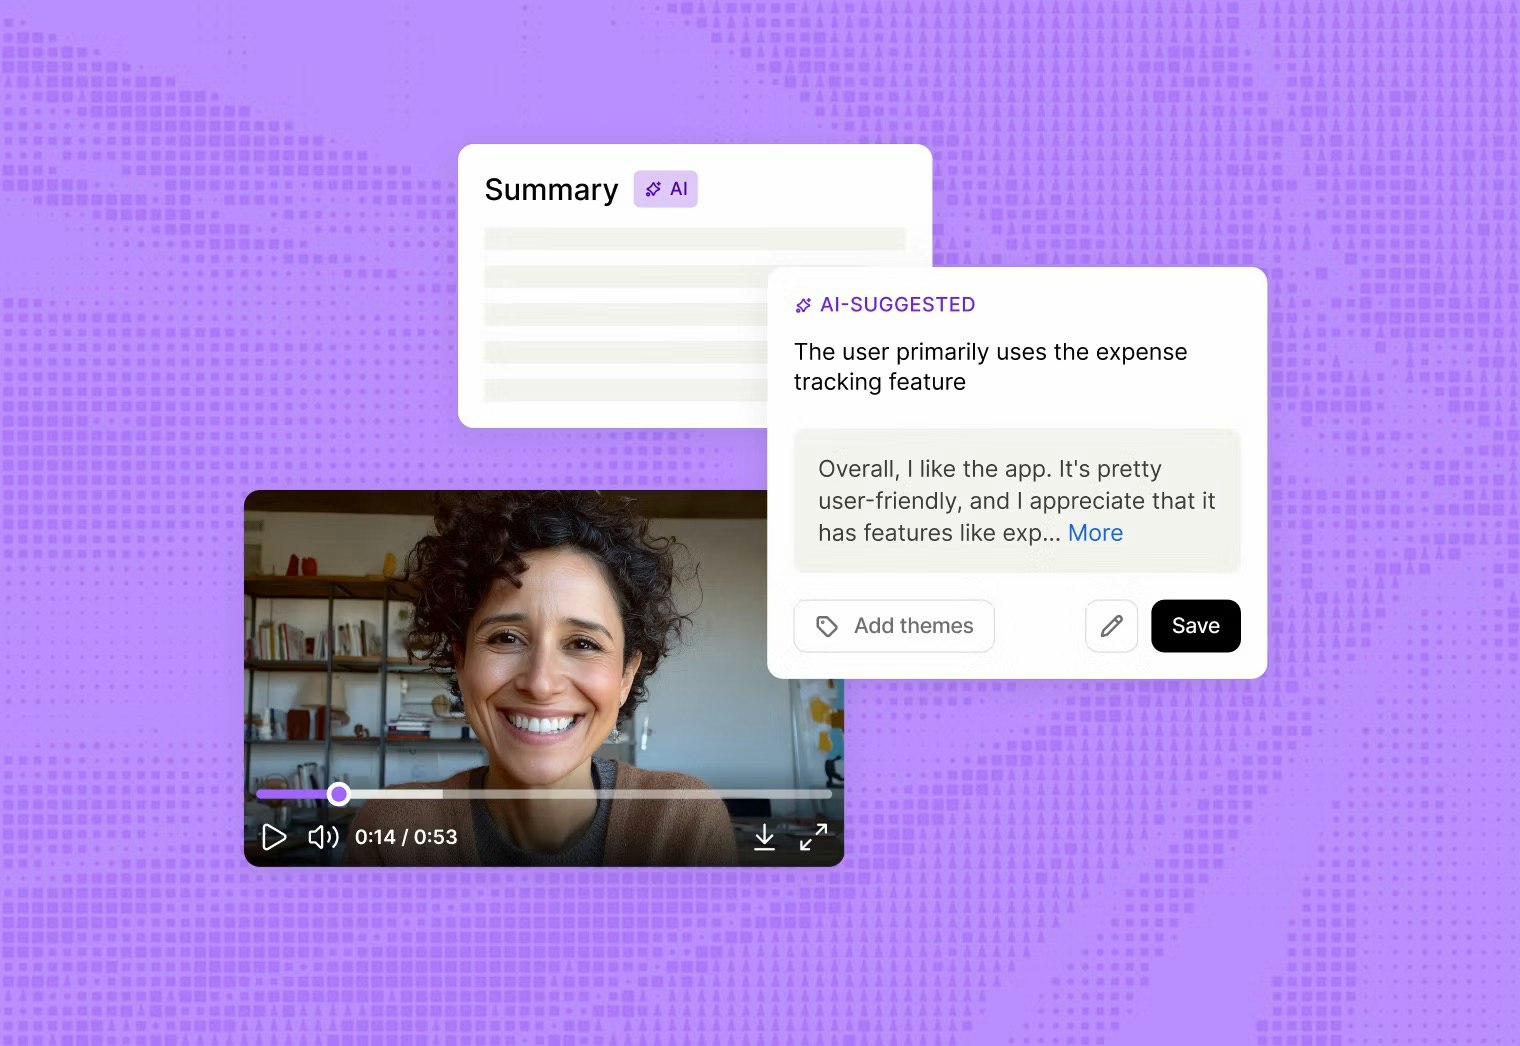
An AI-first user research platform like Maze makes this step super easy. Once your sessions are complete, Maze’s interview studies automatically run thematic analysis across all transcripts.
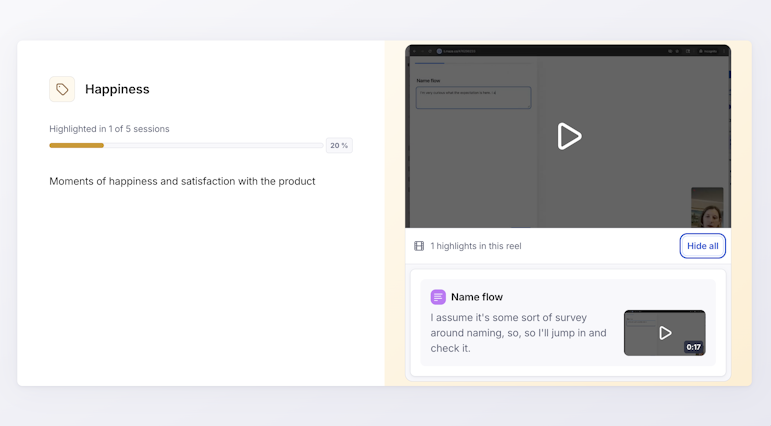
It groups patterns into named themes and shows you what percentage of sessions each theme appears in. Each theme comes with a sentiment indicator, an AI-generated summary, key findings, and timestamped video highlights so you can go straight to the relevant moment in the recording.
You can click into any theme, review the context behind it, and edit or refine the AI's groupings based on your judgment.

4. Review your themes
At this point, you have a set of potential themes. But that process is not the same as having the right themes. This step is where you pressure-test them, checking that they are accurate and genuinely grounded in what your participants said.
Following Braun and Clarke’s guidance on thematic analysis, it helps to review your themes at two levels. First against the coded extracts in each theme, and then against the full dataset.
This two-step review helps you check both whether each theme ‘hangs together’ internally and whether your overall set of themes tells a fair story of the study as a whole.
Phase 1: Check themes against coded data
Start by reviewing each candidate theme alongside the codes and data extracts it contains. Ask yourself:
- Do all the extracts in this theme really speak to the same underlying idea, or are some codes off-topic?
- Is the theme internally coherent, or is it trying to do too many jobs at once?
- Are two themes overlapping so much that they should be merged into one or split into clearer, focused themes?
Phase 2: Check themes against the full dataset
Once each theme feels internally consistent, zoom out and review your themes against the entire dataset. This second pass helps you catch blind spots and avoid over-focusing on the most obvious or ‘loudest’ themes.
Consider questions like:
- Are there important patterns in the data that none of your current themes capture yet?
- Is a theme appearing so rarely across participants that it does not hold enough weight to stand on its own?
- Are some participants’ experiences underrepresented because they barely show up in any of your themes?
If you discover gaps, you can create a new theme or adjust existing themes so they better represent what’s in the data.
By the end of this step, you should have distinct, internally consistent themes that genuinely represent your entire dataset.
5. Define, name, and report your themes
The final step is compiling a UX research report communicating your findings from the data analysis process. This report will allow teams to make informed decisions and modify the design and UX strategy whenever necessary.
Before you get there, make sure each theme is clearly defined and well-named. Write a short definition for each theme. A good definition answers four questions:
- What is this theme about?
- What does it reveal about your users or their experience?
- How does it connect to your research question?
- What sits inside it, and what does not?
It captures the central idea, the ‘so what,' in a way that is specific, meaningful, and self-explanatory to anyone reading your report. For example:
With your themes defined and named, you're ready to write up your findings. This is a narrative that walks your reader through each theme, explains what it means, and backs it up with specific data extracts.
For each theme, cover:
- What the theme is and what it reveals
- Specific quotes or data extracts that illustrate it
- How it connects to your research question or product decisions
- Any notable sub-themes or outliers worth flagging
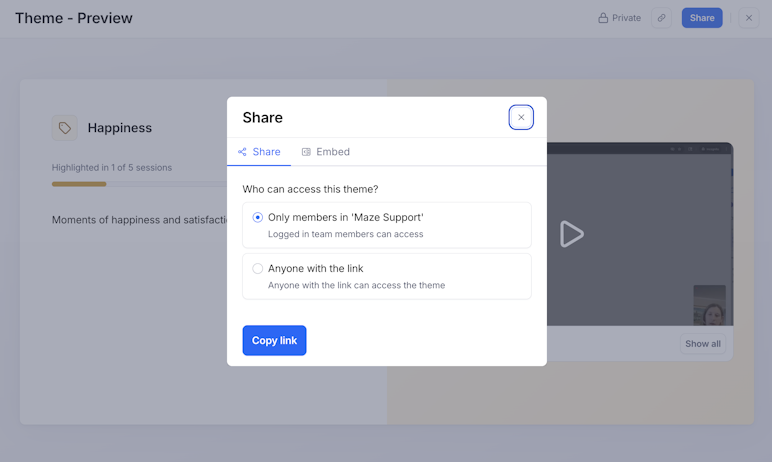
And if you’ve used Maze, your report is largely built for you. Maze auto-generates a shareable report for every moderated study. The report is organized by theme, and each theme slide shows the associated highlights, the AI-generated summary, and key findings so you can win stakeholder buy-in.
You can share the report via a private link for team members or a public link for stakeholders outside your workspace. You can also create highlight reels and share or download them to embed in presentations or Slack updates.

The pros and cons of thematic analysis
Thematic analysis is not a one-size-fits-all solution. Here are the pros and cons you need to consider before adding this research method to your UX research toolkit.
The pros
Here are the main benefits of conducting thematic analysis:
- Iterative data: As you analyze more data and find new themes, you can consistently refine your themes until you get a clearer picture of your user's expectations
- In-depth insights: Unlike other qualitative analysis methods, like grounded analysis or discourse analysis, thematic analysis helps identify less obvious information about users, like their motivations, perspectives, and emotions
- Short learning curve: The thematic analysis approach is easy to learn and implement, even if you're a beginner researcher
- Wide applicability: You can use the thematic analysis method for multiple use cases, like market research, customer experience, and competitor benchmarking
The cons
Thematic analysis also has its limitations, such as:
- Subjectivity and bias: Cognitive biases of the researcher can negatively influence the analysis process and potentially lead to skewed results
- Time-consuming process: Compared to other qualitative research methods, this process takes more time since it relies heavily on manual effort and understanding (unless you have a tool that can help identify themes)
- Limited reliability: It’s difficult to establish the reliability of thematic analysis data because researchers with varying perspectives can question the validity of findings
✨ Speed up thematic analysis with AI: Thematic analysis doesn't have to be time-consuming–let artificial intelligence do the heavy lifting with AI thematic analysis.
6 tips to extract better insights from thematic analysis
Finding and documenting insights can make or break your thematic analysis approach. Without the right research tools and a defined framework to extract insights, you expose your research to data misrepresentation and superficial analysis. What’s more, doing all of the above manually, or without the right resources, is a lot of work.
Here are six tried-and-tested tips to prepare against any issues:
1. Avoid paraphrasing
When reporting on qualitative research, it can be easy to paraphrase feedback to ‘sum up’ or give ‘the gist’ of what was shared. Instead, focus on accurately interpreting and presenting what users said in interviews, surveys, or focus groups.
Look at the finer details of each user response, then try to contextualize why they said what they said. Dig into the nuance of their response and refine this to provide a quote, explanation, and takeaway. You might have to re-read their response multiple times and connect the dots to draw your own conclusions. Don’t be afraid to take your time.
2. Look for insights, not data
Go beyond the obvious data to find more meaningful insights. Immerse yourself deeply into the research data and identify patterns that you'd have otherwise missed.
For example, data might say users like your tool’s intuitive interface. Looking deeper, you might see they value it because it reduces training time and fast-tracks onboarding for new team members. That becomes an evergreen insight you can bring into future product development. Aim to understand the essence of every user response, and what it means going forward, rather than looking at its literal meaning.
3. Base themes on data, not on questions
When you analyze data thematically, don’t organize themes around the questions you asked—for example, ‘task tracking,’ ‘pricing,’ or ‘dashboards’. Questions can pull the narrative toward your assumptions instead of users’ experiences.
Focus themes on what participants say and do—for example, ‘seamless communication,’ not a prompted feature like ‘task tracking.’ If the data points elsewhere, follow it, even when that means moving away from your initial hypothesis.
4. Ensure there's enough data to back up your themes
One of the most important things to remember in a thematic analysis process is that you should have enough data to create themes. How many users you need for user research varies on your goal, method, and resources, but broadly speaking you need enough to generate adequate datasets.
Work to support each theme with recurring patterns in your data and include as many user quotes from your research as possible to validate it.
5. Ensure your themes build your narrative
Themes should not exist in isolation. They should collectively build a coherent narrative for your research. You need to stitch the data together to tell a logical story and make a case for your product and design decisions.
You can’t have a few themes connected to each other and a few on completely different topics. Each theme should contribute meaningfully to the overall story and provide relevant, contextual insights.
6. Use AI-assisted tools to speed up your analysis
Working through dozens of transcripts, coding line by line, and spotting patterns across hundreds of data points takes time. AI research tools can handle large quantities of data in an instant.
Haley agrees, having used AI to sift through research data:
AI can be an amazing tool to help you sort through feedback. I’ve put feedback into AI solutions and asked them to identify general themes, which saves so much time and can help me consolidate the feedback without human error.
Haley Stracher
CEO and Design Director at Iris Design Collaborative
Share
Maze AI does these tasks automatically. Once your sessions are recorded, it transcribes them, identifies emerging themes across all transcripts, ranks them by frequency, and pulls representative quotes for each one. Each theme comes with a sentiment indicator and timestamped video highlights so you can verify the interpretation against the actual session.

Example: Conducting thematic analysis with Maze
Maze is an AI-first user research platform that supports every stage of the thematic analysis process. From participant recruitment to automated reporting, Maze handles all the heavy lifting so you can focus on actioning findings.
Let’s say you’re a UX researcher at a B2B company, and your task is to understand how enterprise clients use your project management tool. You want to identify common pain points, feature requests, and workflow patterns. Here’s how Maze helps streamline every step.
Find the right participants with Maze Panel
To get started, you need participants who are actual users of your (hypothetical) project management tool and work in enterprise settings.
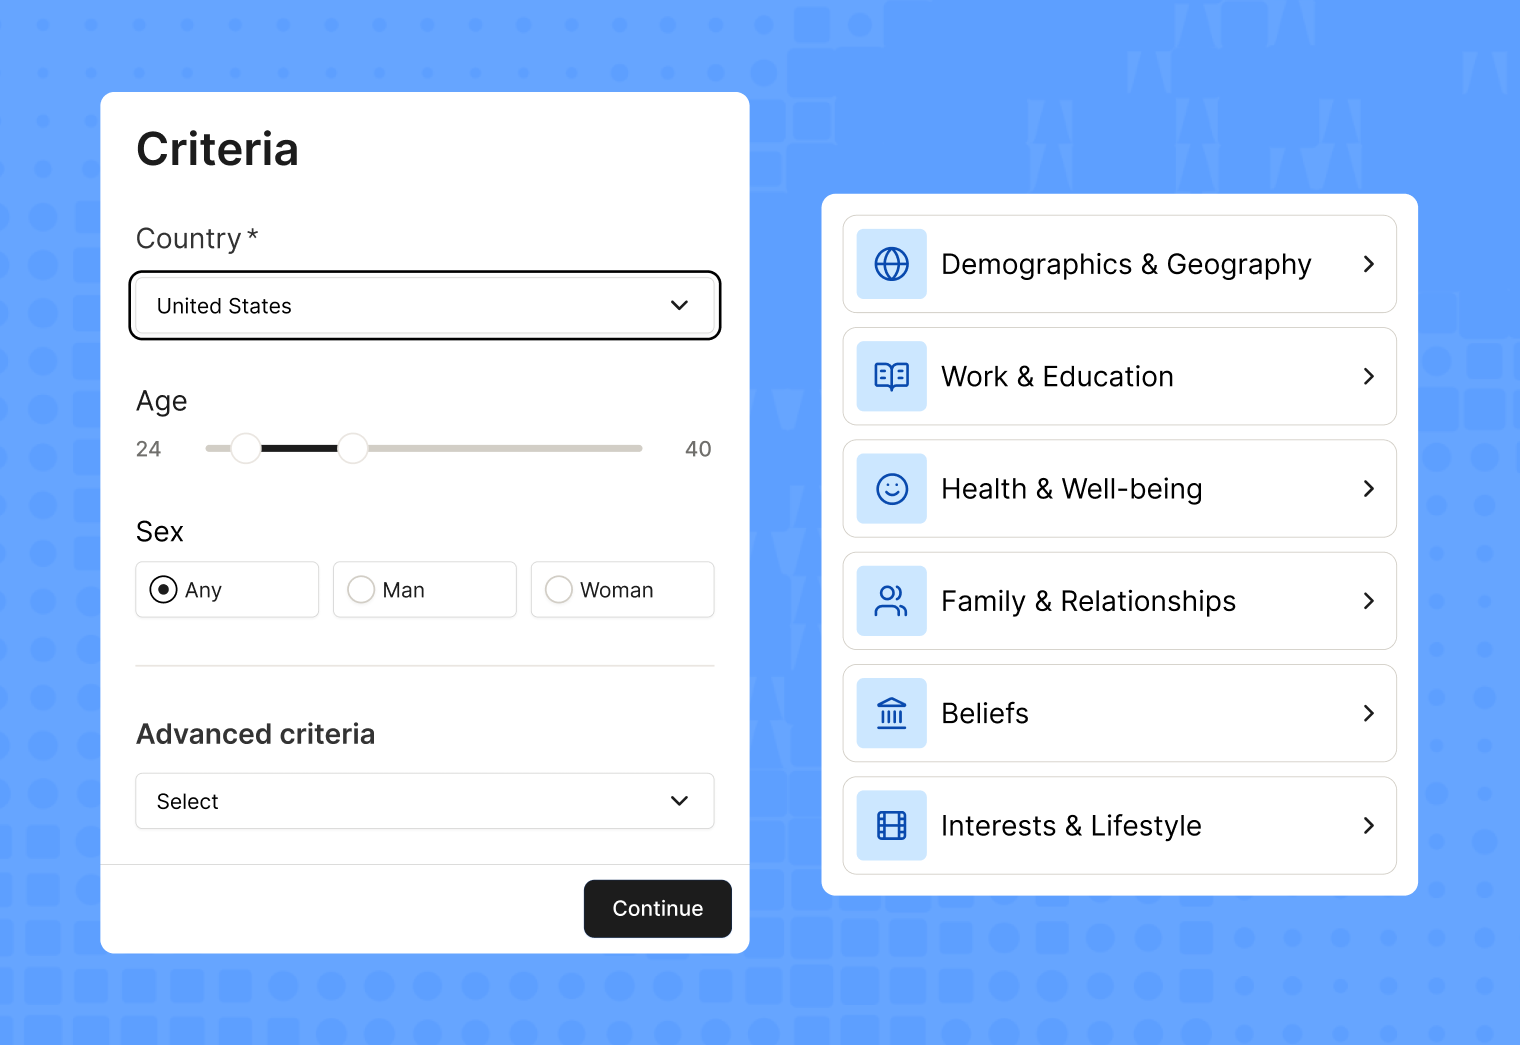
With Maze panel, you can recruit from a global pool of B2B and B2C participants across 130+ countries using 400+ filters, so the people you speak to closely match your research goals and user personas.
From there, Maze interview studies handle scheduling, reminders, and hosting via built-in video or tools like Zoom and Teams, while the AI moderator can also run interviews autonomously using your preset questions and follow-ups.

Maze AI identifies themes across your transcripts
Once your sessions are complete, it's time to look across all your transcripts and find what patterns are emerging. Maze scans all your session transcripts at once and automatically groups recurring patterns into named themes.
For each theme, Maze shows you how many sessions it appeared in, whether the sentiment is positive or negative, an AI-generated summary of what the theme reveals, and timestamped video highlights so you can go straight to the relevant moment in the recording and verify the interpretation yourself.

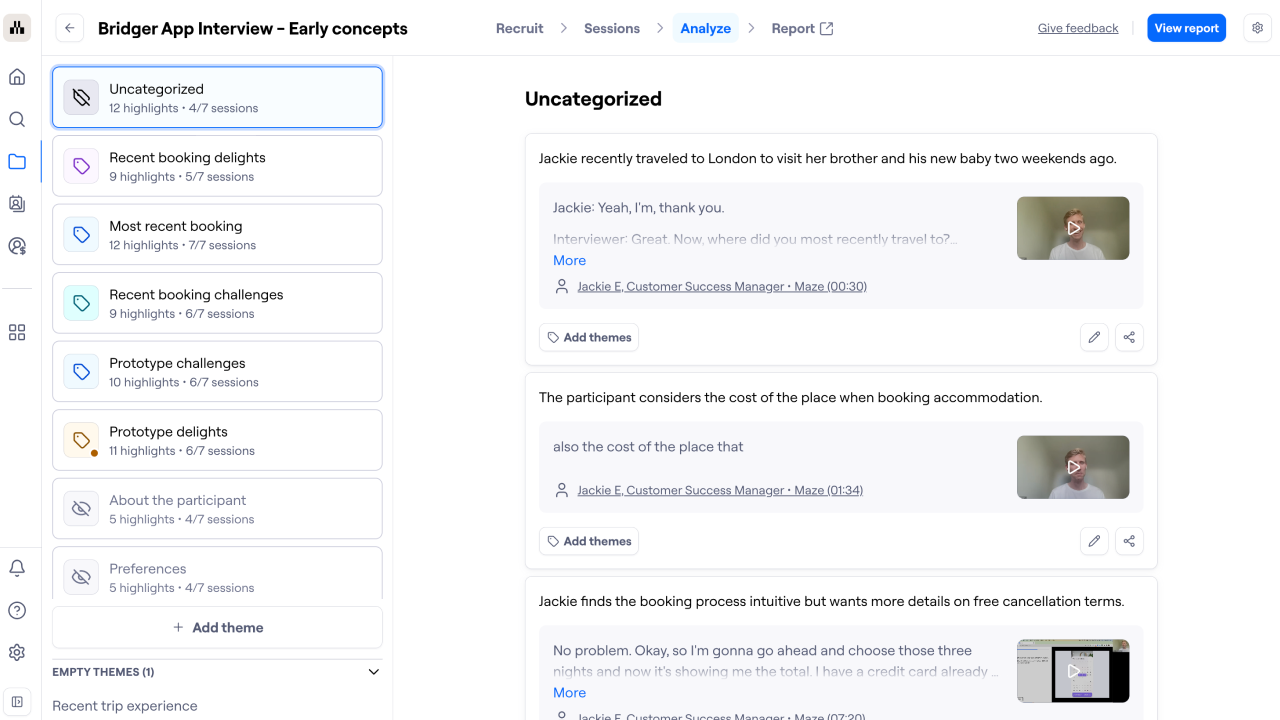
If you already have a hypothesis going in, say, you suspect integration issues are a recurring pain point, you can bring your own themes as a starting point and let Maze build on them. Anything that doesn't fit neatly into a theme gets flagged separately so you can review and assign it manually.
Turn your themes into a report
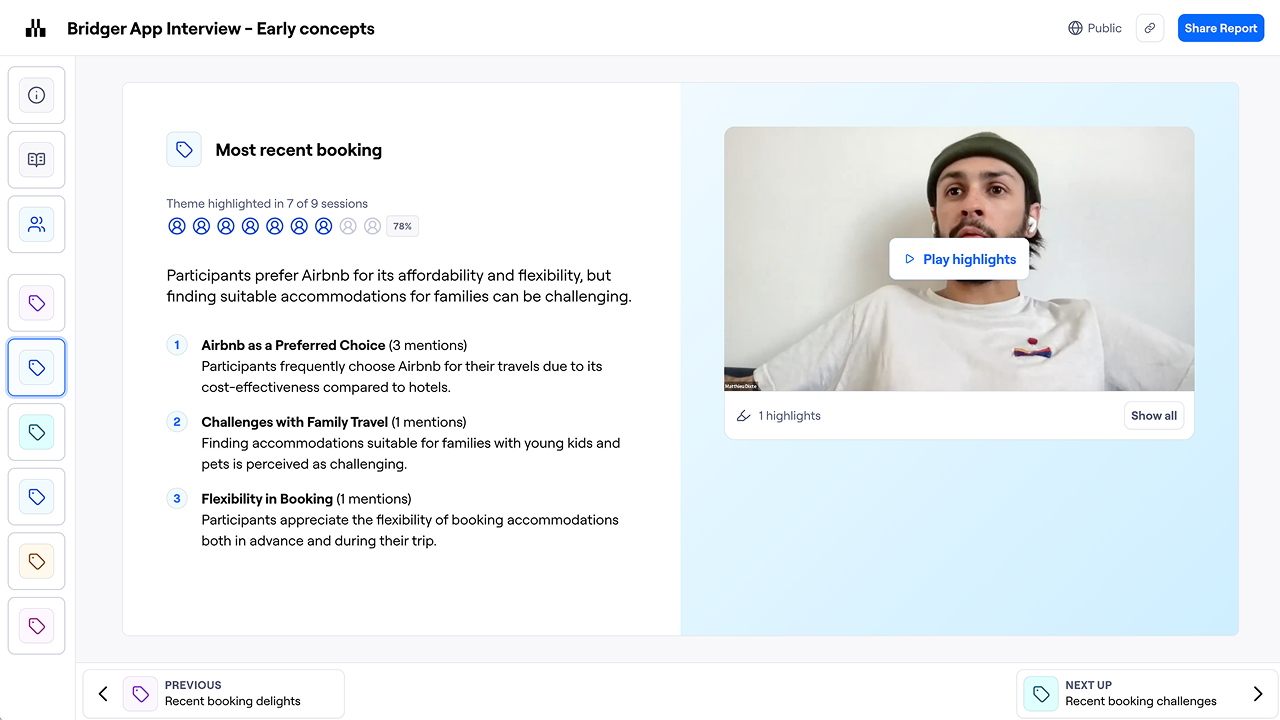
Maze auto-generates a shareable report for your study. It opens with an executive summary, followed by a slide for each theme, showing the associated highlights, AI-generated summary, and key findings. Individual session overviews are included at the end so stakeholders can dig into specific participant responses if they want to.
You have two ways to share it:
- A private link keeps the report inside your workspace, useful for sharing with your product team or storing in your research repository
- A public link lets anyone with the URL view it, which is useful for stakeholders or clients outside your organization

Turn qualitative data into decisions your team can act on
Thematic analysis is a meticulous process of analyzing qualitative data and uncovering rich insights about your users and products. You still need to review transcripts, create codes, group related ideas into themes, check those themes against the data, and turn everything into a clear report.
Maze brings interview recordings, transcripts, AI-generated themes, summaries, video clips, and reports into one workflow. You can review the suggested themes, check them against the original sessions, and refine the findings before sharing them with stakeholders.
With Maze, you build reports that your team can turn into better product decisions.


Frequently asked questions about thematic analysis
Are thematic analysis and content analysis the same?
Are thematic analysis and content analysis the same?
No, thematic analysis differs from content analysis. Content analysis focuses on a more surface-level analysis to find trends in the data, whereas thematic analysis creates meaningful themes from the data to better contextualize it.
What is the difference between inductive and deductive thematic analysis?
What is the difference between inductive and deductive thematic analysis?
Inductive thematic analysis starts with the data. You review your interview transcripts, survey responses, or notes without a fixed hypothesis, then develop codes and themes based on the patterns you find.
Deductive thematic analysis starts with an existing idea, theory, research question, or hypothesis. You analyze the data to see whether it supports or challenges what you already believe.
What software help with thematic analysis?
What software help with thematic analysis?
AI-first user research platforms like Maze can help with thematic analysis across the full research workflow. You can run interviews, upload existing recordings, transcribe sessions, and identify recurring themes.
Maze also integrates with tools like Zoom, Microsoft Teams, Google Calendar, Outlook, iCloud, Slack, and Miro. These integrations make it easier to schedule sessions, run interviews, collaborate on analysis, and share findings.