


Mixed methods research is one of the most popular and powerful UX research approaches—blending numbers with narrative to garner a holistic understanding of your product or research question.
Whether you’re in UX research and design, education, healthcare, or social sciences, mixed methods research can help you find insights and make better decisions.
Read on for a breakdown of what mixed methods are, their strengths and weaknesses, when to use them, and how to analyze the data.


What is mixed methods research and when should you use it?
Mixed methods research involves collecting, analyzing, and integrating both quantitative and qualitative UX research methods within a single study. It is unique to other UX research techniques in that it combines data types, encouraging product teams to use qualitative feedback to explain the story behind quantitative numbers.
- Quantitative data can come from UX surveys, product analytics, usability testing, experiments, or statistical databases and provide broad numerical insights
- Qualitative data is gathered through user interviews, focus groups, or contextual inquiries and offers a deep, contextual understanding of the subject matter
Why use a mixed methods approach?
The power of mixed methods research is simple: it allows you to combine the best parts of both types of data—quantitative research methods, like surveys, give you broad trends, while qualitative methods, such as interviews, dig deep into personal experiences.
Anthony J. Onwuegbuzie and R. Burke Johnson, in Mixed Methods Research: A Research Paradigm Whose Time Has Come, highlight how blending these methods allows researchers to leverage the strengths of both approaches. They identify mixed methods research as one of the “three core research paradigms: qualitative, quantitative, and mixed methods.”
Like any technique, however, mixed methods research has both strengths and weaknesses to consider.
Strengths | Weaknesses |
|---|---|
Get balanced insights by combining quantitative and qualitative insights | Expect mixed methods research to take longer and require more resources, as you’re conducting multiple research studies |
Increase research and findings validity with different types of data that point to the same conclusion | Consider how conflicting results could confuse your study and force you to conduct unnecessary clarifying research |
Enjoy greater flexibility with adaptable research designs and approaches | Ensure you can adequately manage the volume of mixed methods data you’ll collect |
When should you use mixed methods research?
Mixed UX research methods are useful when neither qualitative nor quantitative data alone can fully answer your research question. Evaluative research further helps to assess the effectiveness of your mixed method research findings and ensure they meet user needs.
For example, use mixed methods research when:
- You need to go beyond numbers (generalizability): Quantitative methods, like surveys, provide broad trends and patterns that are relevant to a wider population. For example, a survey might show that most users enjoy a new app feature, but it won’t capture why some users might dislike it.
- The why matters (contextualization): Mixed methods allow you to put numerical findings in context, adding rich detail to your conclusions. For example, if analytics show that users are spending less time on your app (quantitative), interviews can help you understand the reasons behind this behavior, such as frustration with a recent update or a lack of engaging content (qualitative).
- Credibility is important (credibility and triangulation): When both data types converge on the same conclusion, it strengthens your findings. For example, the combined evidence is more credible if survey data indicates that most users prefer a particular software interface and focus groups echo this preference.
- You need to track changes (developmental purposes): Mixed methods are invaluable when one type of data informs the other. For example, initial qualitative research with a small group of beta testers can uncover key issues and user needs, which can then be explored quantitatively with a larger user base to see how widespread these issues are.
- Understand complex issues (complementary insights): Different data types can offer complementary insights. For example, in a study on software usability, quantitative data might show a drop in task completion rates, while qualitative data reveals specific pain points and user frustrations. This combined approach can guide more effective design improvements.
What are the types of mixed methods research design?
The type of mixed methods research design you choose depends on your research goals, the timing of data collection, and each data type. Here are some key factors to consider:
- Your research approach: Are you trying to understand existing findings (explanatory) or dig deeper into a topic (exploratory)?
- Your research questions: Do your questions need big-picture answers (like how many users are happy) and detailed explanations (like why some users are unhappy)?
- Existing data availability: Is there any existing information you can use from previous studies or a research repository (like user demographics)?
- Data you can collect yourself: What kind of in-depth information do you need to gather from users (through interviews, testing, etc.)?
Whether you're a data diver or a narrative novelist, understanding these research methods can make your studies more dynamic and insightful.
📚 A UX research repository is crucial for keeping track of research findings. You need a centralized database to store and manage all your qualitative and quantitative data. This ensures that your research is organized, accessible, and reusable for future studies.
Let’s look at the most common types of mixed methods research design:
Convergent parallel

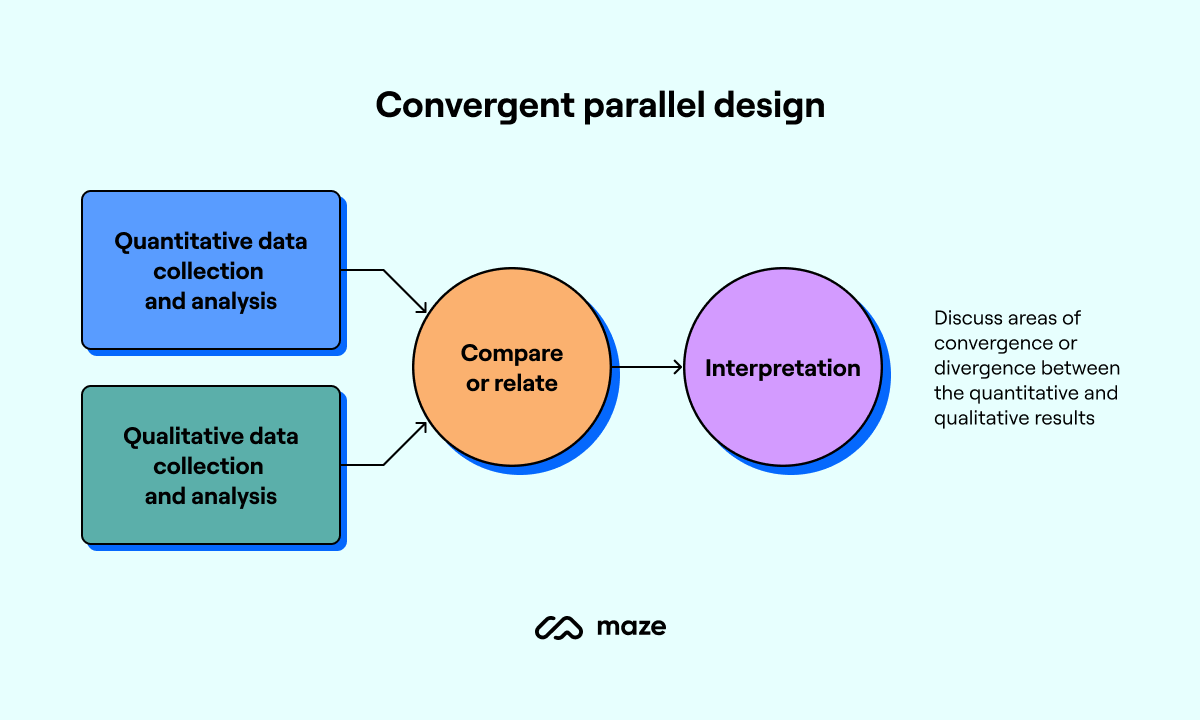
Convergent parallel design involves collecting qualitative and quantitative data simultaneously but analyzing them separately. The primary goal is to merge the two datasets to provide a complete understanding of the research problem.
For example, let’s say you want to study user satisfaction with a new mobile app. Here’s how you might use the convergent parallel design:
- Qualitative results: Conduct in-depth user interviews with 30 participants to gather detailed insights into their experiences and perceptions of the app. Plus, analyze 200 user reviews from app stores. You might use prompts like, "What features do you find most valuable?" and "Please describe any difficulties you've experienced while using the app."
- Quantitative study: Use analytics data to measure user engagement metrics like session duration and feature usage, then distribute UX surveys to gather quantitative satisfaction scores.
Concurrent embedded design

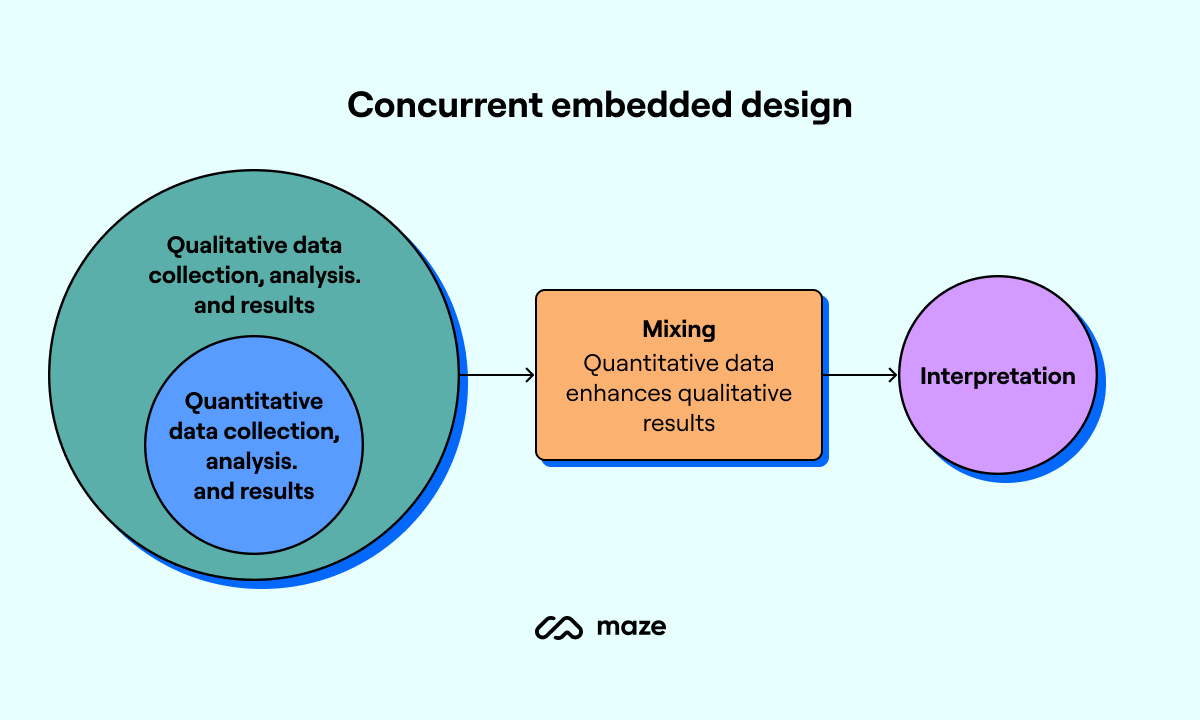
Embedded design is a mixed methods research approach where qualitative and quantitative data are collected simultaneously, but one type of data is supplementary to the other.
The secondary data provides additional context and can help explain or clarify the primary findings. This approach is particularly beneficial when time or resources are limited, as it allows for a more comprehensive analysis without doubling the workload.
Explanatory sequential design

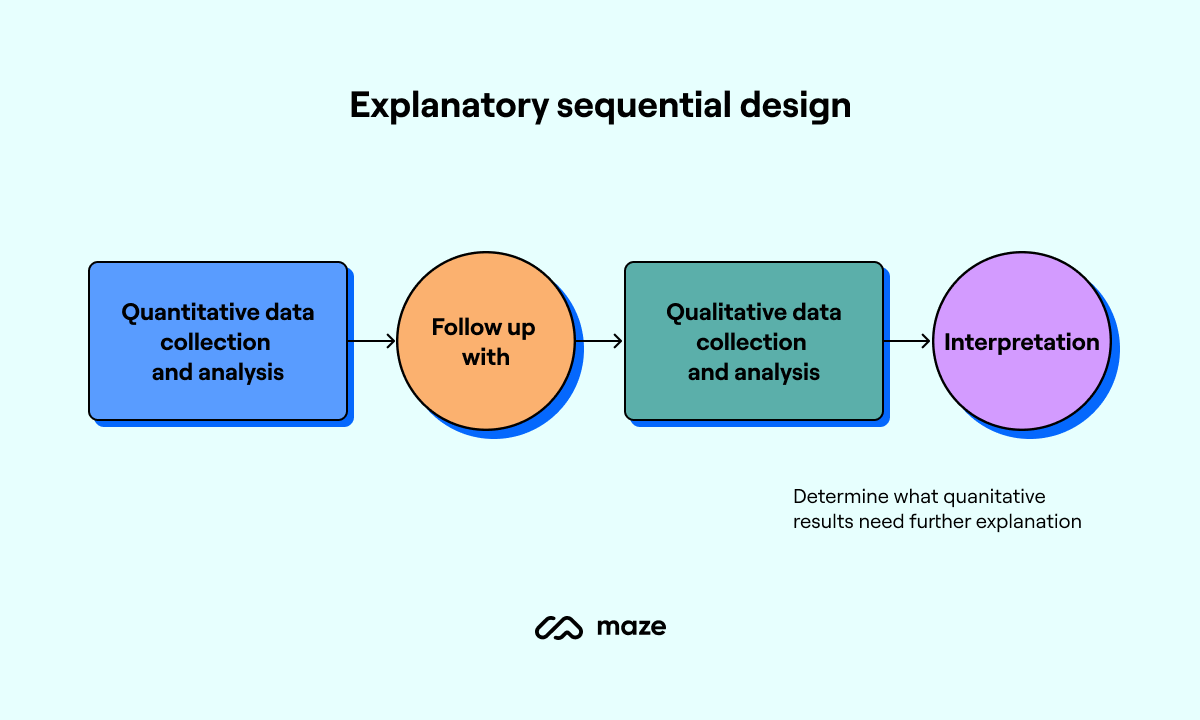
Explanatory sequential design is a popular mixed methods research approach introduced by John W. Creswell and Vicki L. Plano Clark. This research design involves collecting and analyzing quantitative data first, followed by qualitative data collection and analysis.
According to Creswell, this approach is particularly useful when researchers need to explain relationships found in quantitative data.
The process typically involves two phases:
- Quantitative phase: This involves collecting numerical data through methods like surveys or experiments. The goal here is to identify patterns, trends, or relationships.
- Qualitative phase: Qualitative phase: After analyzing the quantitative data, researchers collect qualitative data with qualitative approaches, like interviews or focus groups, to provide deeper insights. This phase helps explain the ‘why’ or ‘how’ behind the quantitative findings.
Creswell emphasizes that one of the strengths of this design is its simple structure, making it easy for researchers to manage and for audiences to understand the research process and findings.
Exploratory sequential design

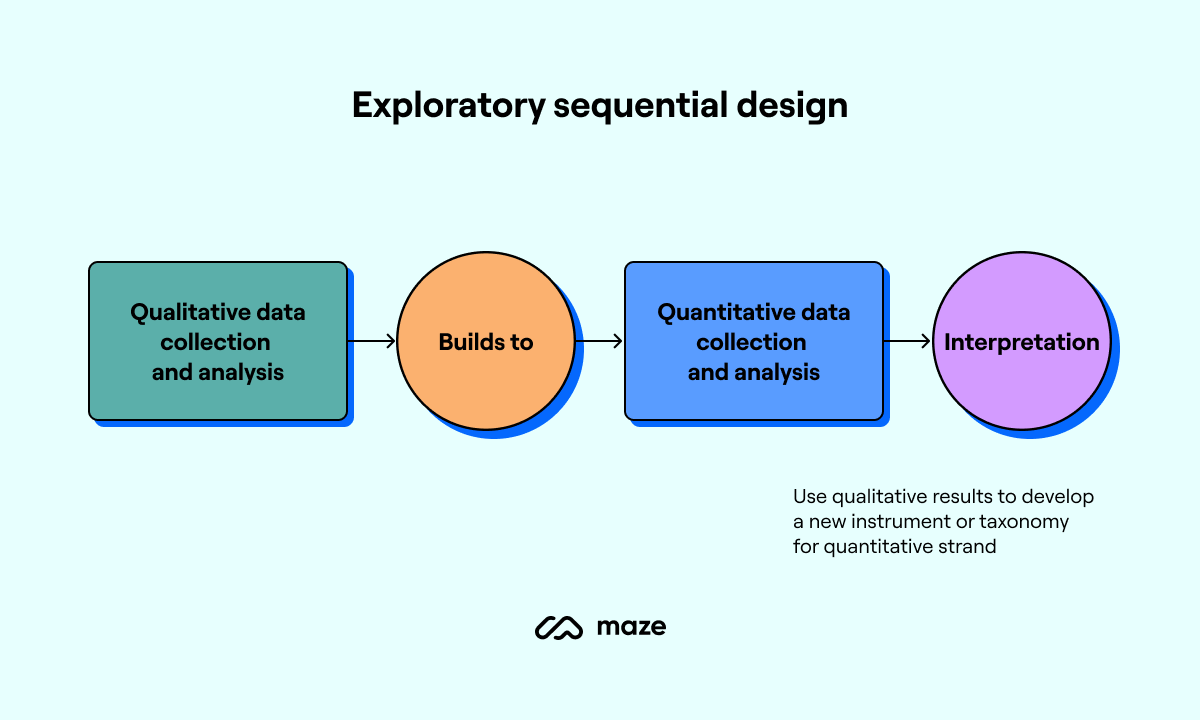
Exploratory sequential design begins with qualitative data collection and analysis, followed by quantitative data collection. This immersive approach helps generate rich, detailed data that lays a strong foundation for the subsequent quantitative analysis.
For example, let’s say a researcher wants to understand why people don't meditate regularly. They could start with generative research techniques, like conducting workshops where participants discuss their daily routines and barriers to meditation. These qualitative insights reveal underlying themes and patterns, like time constraints and lack of motivation.
Next, the researcher analyzes these qualitative data to identify key factors impacting wellbeing habits. Based on these insights, they develop a survey to quantitatively measure how widespread these barriers are among a larger population.
So, that’s how you collect data. But how do you analyze it? Unsurprisingly, there are multiple analysis and interpretation methods commonly used in mixed methods research. Let’s look at some.
How to analyze mixed methods research data: 3 Ways to combine qualitative and quantitative data
Combining different types of research data can add credibility to your research findings. Let’s look at how to conduct mixed methods research:
- Triangulation protocol
- Following a thread
- Mixed methods matrix
Triangulation protocol

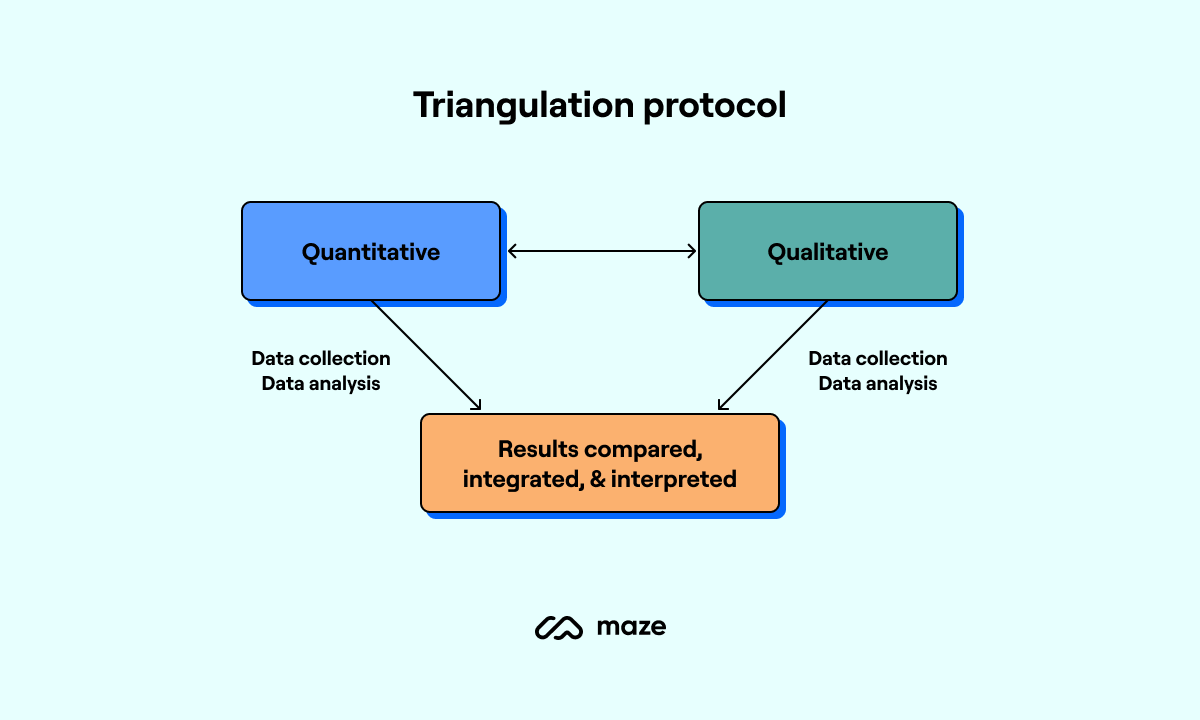
The triangulation protocol in mixed methods research is a systematic way to use multiple data sources, techniques, or perspectives to get a clear understanding of a research problem. The goal is to capitalize on the strengths of both types of data while minimizing their individual weaknesses.
Let's say you want to conduct a study aiming to evaluate the effectiveness of a new educational program on student performance, and you arrive at the following datasets:
- Quantitative finding: 80% of students improved their math scores after the program
- Qualitative finding: Students reported that interactive activities helped them understand math concepts better
When you merge these findings, the research concludes that the interactive activities (identified qualitatively) are likely a significant factor contributing to the improved scores (quantitatively).
Following a thread

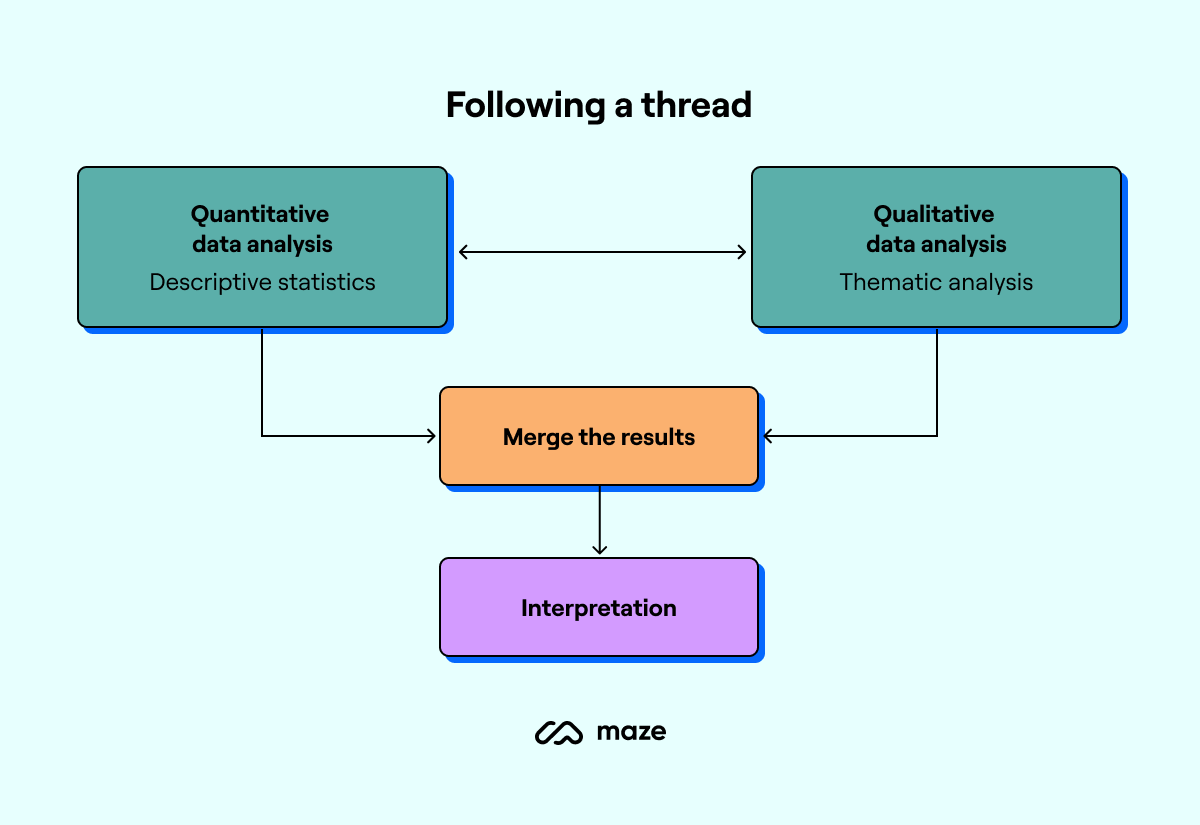
The following a thread method allows researchers to trace a specific theme or concept across both qualitative and quantitative data sets.
Here’s how it works:
- Identify key themes: Begin by identifying key themes or variables that are central to your research questions. These themes will serve as the ‘threads’ you’ll follow through your data.
- Extracting data: Extract relevant data segments related to each theme from qualitative (e.g. interviews, focus groups) and quantitative (e.g. surveys, statistical data) sources. This involves coding qualitative data and identifying relevant quantitative measures.
- Mapping data: Create a map or matrix that links data segments from different sources according to the identified themes. This matrix helps visualize how different data points converge or diverge on the same theme.
- Comparative analysis: Compare the data segments within each theme to identify patterns, consistencies, and discrepancies. Look for how qualitative narratives support or contradict quantitative findings.
- Synthesis and interpretation: Synthesize the findings to develop an understanding of each theme. Interpret the data by integrating the qualitative insights with the quantitative results, explaining how they complement or contrast with each other.
Mixed methods matrix
A mixed methods matrix is a visual tool used to integrate and compare qualitative and quantitative data in mixed methods research. It helps researchers organize data according to key themes or variables, facilitating a comprehensive analysis and interpretation.
The matrix consists of several rows and columns:
- Rows represent key themes or research questions
- Columns represent different data sources or methods (e.g. interviews, surveys, observations)
By populating each cell with relevant data segments, researchers can easily identify areas of convergence, divergence, and complementarity.
Let’s say you want to answer this research question: How does a new health intervention impact patient satisfaction and health outcomes?
You would populate the matrix as follows:
Themes | Qualitative data (Interviews) | Quantitative data (Surveys) | Observational data |
|---|---|---|---|
Patient satisfaction | ‘Patients feel more listened to and supported’ | 85% of patients reported high satisfaction | Observations show increased patient engagement |
Health outcomes | ‘Patients report fewer symptoms and quicker recovery times’ | Health metrics improved by 30% | Notable reduction in hospital readmissions |
How to conduct mixed methods research: A mixed method research example
Let’s say you own a project management app and want to understand user satisfaction and identify areas for improvement. Here are eight steps to apply mixed methods research—using the convergent parallel technique—to discover user pain points and create a better user experience.
Step 1: Define your research objectives
In UX research, asking the right questions is crucial for identifying user needs and pain points effectively. But in order to write the right user research questions, you need to define a clear objective. What are you looking to understand?
Defining a clear UX research objective helps guide all other research decisions and acts as a lighthouse that guides your research project.
In our example, our research objective could be ‘to explore user experience and identify areas for improvement within our project management app’.
Step 2: Design your study and recruit participants
Ensure your study is designed to allow integration of both quantitative and qualitative data. There are various mixed method research designs to choose from—the right one for you depends on your research objectives and preferences.
At this stage, you should also establish a clear strategy for data integration and decide how you’ll combine the qualitative and quantitative data during the UX reporting and analysis phase. This might involve merging data sets for comparative analysis, or embedding one data set within the other to provide additional context.
The integration plan should reflect your research goals and ensure that the combined data offers a clear understanding. For our study, we’ll design a convergent parallel mixed methods study and triangulate our data during the analysis phase. This enables us to find our what and our why.
This is also when you need to recruit research participants for your study. Consider what you’re studying and identify your target test audience. You then need to create a call-out for your research study—either on socials, via email, or with In-Product Prompts.
Alternatively, you can find and filter research participants using Maze Panel, then manage your participant relationships using Maze Reach.
Step 3: Collect quantitative data
Next up, you want to start gathering your quantitative data. A good way to do this is with a survey to collect numerical data that can be statistically analyzed. For example, a user satisfaction survey that includes rating scales (1–10) for various aspects of the software.
For our research into app user satisfaction, we asked:
- Please rate your overall satisfaction with the app (1–10)
- How often do you use the app per week?
- How easy is the app to use on a scale of 1 to 10?
- How likely are you to recommend the app to a friend or colleague (1–10)?
❓ Need a quick and easy way to create and manage surveys? Maze Feedback Surveys simplify your feedback collection process so you can focus on making the changes your customers want to see. You can quickly create surveys tailored to your needs with Maze's survey templates.
Step 4: Collect qualitative data
Once you’ve got your quantitative data, it’s time to collect your qualitative data. Consider conducting user interviews or focus groups to obtain detailed, descriptive data that provides context and deep understanding.
For our study, we selected 20 users from the survey who gave varied ratings and conducted 30-minute interviews, asking:
- What do you like most about the app?
- What features do you find difficult to use?
- Can you describe a recent experience using the app?
- What improvements would you suggest?
💬 User interviews are resource-intensive and time-consuming. Speed them up with Maze’s end-to-end user interview solution: Interview Studies.
Step 5: Quantitative data analysis
Now you’ve got all your data—it’s time to dig in. For your quantitative data, this involves using statistical methodology to identify trends and patterns.
When we looked at our example data, we calculated:
- CSAT score: 75%
- Frequency of use: 70% use the app daily
- Ease of use average score: 6.8/10
- Net Promoter Score (NPS): 65
Step 6: Qualitative data analysis
Analyzing qualitative data involves coding and categorizing qualitative responses to uncover themes and patterns. Identify recurring themes in user feedback, such as ease of use, functionality, and improvement areas. If you’re using Maze Interview Studies to analyze your findings, you can automatically extract key themes and summaries to speed this process up.
When reviewing qualitative data, we found a number of interesting nuggets in our qualitative data:
- Users express dissatisfaction with the app’s usability, specifically the navigation between different functionalities
- Users wish they could access their billing details via the app, instead of solely via the web
- User find the core functionality—the project management features—to be highly valuable to their day-to-day, but also report finding the interface to be clunky and unintuitive
Step 7: Integrate data and interpret findings
Following your analysis, combine the findings from both data sets and draw conclusions. Look for correlations and insights that span both types of data.
Example integration:
- High satisfaction scores (75%) but lower ease of use (6.8/10) prove a strong product market fit but call for a more intuitive experience
- Further qualitative research agreed with this conclusion and identified specific areas for improvement, such as adding additional functionalities and improving the interface
Step 8: Report findings to stakeholders for buy-in
Present the integrated results to highlight how qualitative insights support or explain quantitative trends.
The format of your report will depend on your audience:
- Internal stakeholders (project managers, designers): Consider a concise report with clear visuals like charts, graphs, and user quotes to highlight key findings and actionable recommendations
- External stakeholders (clients, investors): Create a formal report with a clear introduction, methodology section, and comprehensive results presentation, summarizing key findings and highlighting the impact on user satisfaction and app usage
Always strive to go beyond what the data says and explain why it matters.
For example, once we’d conducted our research and drawn conclusions, we compiled this into a report that shared:
- Research methods: We used mixed methods research (surveys and interviews) to explore existing user pain points and satisfaction levels.
- Overall findings: User satisfaction is moderately high (7.5/10), indicating a generally positive reception. However, the ease of use score (6.8/10) and qualitative feedback highlight significant usability issues for new users.
- Actionable next steps based on findings: Simplify the user interface to improve the experience for new users, potentially increasing overall satisfaction and ease of use scores.
Conducting mixed methods research with Maze
Mixed methods research is one of the most effective ways to boost your UX insights, and gather a more rounded understanding of your users’ problems and perspectives. Combining research methods and types of data can uncover insights you may otherwise miss. And while there are ideal times to conduct qualitative, quantitative, or mixed methods research, ultimately it really is as simple as more research = more insights.
If you’re looking for the ideal research companion to help conduct mixed methods research, consider Maze. Maze is the user research platform that empowers all teams with the research methods they need to get game-changing insights. Whether it’s a mixed methods study or a one-off test—Maze helps you gather accurate insights, faster, for more informed decision-making.
Frequently asked questions about mixed methods research
What is the purpose of mixed methods research?
What is the purpose of mixed methods research?
The purpose of mixed methods research is to combine quantitative and qualitative data to provide a more complete understanding of a research problem. This approach helps validate findings, explore complex issues from multiple perspectives, and produce more reliable and actionable results.
What’s the difference between qualitative and quantitative research?
What’s the difference between qualitative and quantitative research?
- Qualitative research explores non-numerical data to understand concepts, opinions, or experiences. It uses methods like interviews, focus groups, and observations to gather in-depth insights.
- Quantitative research focuses on numerical data to quantify variables and uncover patterns. It uses methods like surveys, experiments, and statistical analysis to measure and analyze data.
What is the difference between mixed methods and multiple methods?
What is the difference between mixed methods and multiple methods?
Mixed methods research integrates qualitative (e.g. interviews) and quantitative (e.g. surveys) data within a single study. Multiple methods research uses various research approaches, but they can be either qualitative or quantitative. For example, it might use surveys and experiments (quantitative) or interviews and focus groups (qualitative) in different parts of a study without combining the data.