Product analytics isn’t just about tracking clicks and conversions. It’s about understanding the user journey from one to the other—from the first interaction to the final purchase and beyond.
To better understand product analytics, we spoke to Diego Sanchez, Senior Product Manager at Buffer—who led the development of Buffer’s Engage suite of features. He shared some key takeaways on how product analytics helped his team build successful new features to expand Buffer’s toolset for social media marketers.
In this expert-led article, we explore how to identify key metrics that matter and interpret them in a meaningful way. We also look at the benefits of product analytics, and top tools in the market to inform every aspect of product development—from prioritizing new features to refining existing user experiences.
What is product analytics and why do you need it?
Product analytics is the process of analyzing how users engage with your product. It’s about understanding what features they use, how they complete tasks, and where they get stuck within the product.
With product analytics, you can track how people use your product, confirm or disprove assumptions, and make informed decisions based on behavioral data. By making decisions based on what users do, rather than just what they say, you can drive growth and improve customer satisfaction.
Product analytics can help:
- Make data-driven product decisions
- Create a better user experience
- Increase product adoption and retention
- Validate product hypotheses
- Identify hidden opportunities
Let’s look at these one by one.
1. Make data-driven product decisions
Product analytics helps you better understand your customers through information on customer behavior and preferences. Diego, Senior Product Manager at Buffer, uses product analytics to answer user research questions and drive decision-making.
Here are some examples of questions product analytics can answer:
- What features do people use most?
- Where do people get stuck?
- How can you make the onboarding process easier?
- What design changes improve the user experience?
- Who are your most valuable customers?
By focusing on the right questions, you can use product analytics to build a product that works for your user.
2. Create a better user experience
You want to build products that people love. Product analytics is rooted in behavioral data. This means that while customer interviews or UX surveys might tell you what users think about a feature, product analytics reveal how they actually use it—and whether that aligns with their thinking.
For example, you might assume users love a new feature based on feedback, but product analytics show they’re barely using it or abandoning the process halfway. With further UX research, you can conclude that users want the feature’s functionality, but find the UI confusing—allowing you to fix the problem and seeing feedback improve.
Product analytics like this allow you to see where friction occurs and which features need refining—and how. It’s not about opinions, it’s about facts based on real user actions.
The sooner you begin monitoring user behavior, the quicker you can spot issues and make necessary adjustments. Early tracking allows you to pinpoint bottlenecks, observe unexpected user flows, and make informed decisions before small problems snowball into bigger ones.
Even if the data isn’t useful yet because less than 60 people are using your new feature, it’s still a good idea to start collecting as early as possible.
Diego Sanchez
Senior Product Manager at Buffer
Share
This kind of early insight ensures that your product is built with real-world user behavior in mind right from the start.
3. Increase product adoption and retention
Product analytics uncovers insights that enable you to improve both product adoption and retention. Product data can help you guide users to their aha! moment—a key moment in the product adoption process when they realize the value of your product.
By looking at the right usability metrics, you can monitor behavior and engagement, to ensure you continue to meet their needs—a crucial consideration for retention.
By understanding how users engage with your product, and what makes them stick around, you can optimize the experience for new and existing users alike.
4. Validate product hypotheses
When developing new features or making changes to an existing product, teams often start with research hypotheses—educated guesses that need to be tested. Product analytics allows you to test these assumptions by tracking user behavior and comparing it to your expectations.
I would spend the majority of my time thinking about the question I want to ask. Once you have a solid hypothesis, it’s easy to identify the type of metric you need to look at.
Diego Sanchez
Senior Product Manager at Buffer
Share
A product hypothesis typically follows a structure like this:
"We believe that updating the search filter will increase the number of searches per user, as it will make it easier for users to find relevant content."
In this case, the assumption is that users will engage more with the product because the search filter improves usability. To test this, you’d use product analytics to track the search activity before and after the new filter is implemented.
Your analytics might measure:
- How many searches are conducted by users after the filter is introduced
- Whether users are spending more time interacting with search results
- Whether the filter reduces the number of abandoned searches
For example, if the data shows a significant increase in searches and a reduction in abandonment, it validates your hypothesis. However, if there’s little change or a decline in searches, it might suggest the filter isn’t as helpful as assumed and needs further adjustment—or that your problem with searches is somewhere else along the user journey.
5. Identify hidden opportunities
Continuous monitoring can lead to the discovery of unexpected user needs or behaviors that weren’t initially part of the product development focus.
You might find that a particular feature, initially considered secondary, is being used in ways that suggest a new, unanticipated value to users. Or you might find that a group of users consistently combine features in an unexpected way, revealing a new use case.
These insights can inspire new product developments or evolutions that align with how users are naturally using your product, even if it wasn't intended that way from the start. This ongoing discovery process keeps your product strategy user-centered, and allows you to unlock new growth and innovation opportunities.
9 Metrics to track as a product manager
Knowing what product metrics to track is the first step for any product team. To reveal insights or improve product performance, here are the key metrics you should focus on:
- Daily Active Users (DAU) or Monthly Active Users (MAU)
- Feature usage
- Session length
- Sessions per user
- Bounce rate
- Time to Basic Value (TTBV)
- Feature adoption rate
- Rage clicks and mouse thrashing
- Customer engagement score
Let’s take a closer look.
1. Daily Active Users (DAU) or Monthly Active Users (MAU)
DAU and MAU track the number of unique users engaging with your product daily or monthly, respectively. DAU helps gauge daily engagement, showing you which users are consistently interacting with your product. MAU tracks broader engagement trends, helping you understand overall reach.
- DAU: Count the unique users interacting with your product each day.
- MAU: Count the unique users over a 30-day period.
- Stickiness Ratio: DAU ÷ MAU × 100.
The stickiness ratio measures how frequently your monthly active users return to use your product daily. It’s a key metric that reflects how ‘sticky’ or integral your product is to users' daily routines. A higher stickiness ratio means your product is engaging and more essential for users.
2. Feature usage
Feature usage tracks how often users interact with specific parts of your product. It shows which features are popular and which ones aren’t getting much attention. This helps understand what’s working well and where improvements or adjustments are needed.
For example, if a new feature has low usage, it might indicate that it’s hard to find, difficult to use, or doesn’t offer enough value to the user.
Feature usage rate = (Number of users who used the feature ÷ Total number of users) × 100
3. Session length
Session length measures the average time users spend actively engaging with your product during a single session.
A longer session length generally indicates that users find value and are engaged with the product. Conversely, short sessions may signal usability issues, lack of compelling content, or that users struggle to achieve their goals quickly.
Average session length = (Total session duration across all users ÷ Total number of sessions)
4. Sessions per user
Sessions per user is a metric that tracks how often a user engages with your product within a given time frame, such as a day, week, or month. It provides insight into how frequently users are returning to your product, helping you gauge user retention and engagement.
Sessions per user = (Total number of sessions ÷ Total number of unique users) within a specific time frame
5. Bounce rate
This is the percentage of users who leave after viewing only one page or after having had a brief interaction. A high bounce rate indicates that users aren’t finding what they need. This could be because it doesn’t match what they’re looking for, it’s loading too slowly, or any other number of issues.
A lower bounce rate, however, suggests that users find value after landing on your pages.
Bounce Rate = (Number of users who leave after one interaction ÷ Total number of users) × 100
6. Time to Basic Value (TTBV)
This metric measures the time it takes for a new user to experience the primary value of your product—the moment they understand what makes your product useful. The shorter the time to first value, the quicker users understand the product’s benefits, increasing the likelihood of continued engagement.
Time to Basic Value = Time taken from user signup to the first meaningful action that delivers product value (as assigned by your team)
7. Feature adoption rate
This metric tracks how quickly and frequently new users start using key features of your product. A higher adoption rate indicates that users are finding the features relevant and useful, which is essential for driving engagement and reducing churn.
The average core feature adoption rate for SaaS companies is 24.5%, with a median of 16.5%.
This means that if your product’s feature adoption rate is above 24.5%, you're outperforming the average and likely doing a good job of promoting and delivering value through new features. A rate below 16.5% could indicate that your feature is underperforming and might require adjustments in discoverability, onboarding, or usability to encourage higher engagement.
Feature Adoption Rate = (Number of users who have used the feature ÷ Total number of users) × 100
8. Rage clicks and mouse thrashing
Rage clicks and mouse thrashing refer to erratic, repeated movements of the mouse, often indicating that the user is confused, frustrated, or the element isn't responding as expected.
There’s no formula for calculating rage clicks, but monitoring them helps identify points of friction within your product. If your product analytics software highlights that a high percentage of users are rage clicking during their journey, it’s a sign that you need to look into that part of the experience. For example, maybe some in-product text looks too much like a button—causing users to rage click it thinking it should lead elsewhere.
9. Customer engagement score (CES)
CES is a composite metric used to measure overall user engagement with your product. Customer experience KPIs vary between products, so how you calculate your CES will depend on a number of factors. Typically, CES combines a weighted average of several key engagement metrics.
These might include:
- Feature usage: How many features are being used by a user
- Session frequency: How often users log into the product
- Session length: The duration of each session
- Interaction depth: The complexity or number of actions taken within a session
This then provides a single score that represents how actively users are interacting with your product.
You can assign weights to each of these metrics based on their importance to your product. For instance:
CES = (0.5 x Feature Usage)+(0.3 x Session Frequency) + (0.2 × Session Length)
4 Product analytics best practices
Before we dive into top product analytic tools, let’s hear from Diego, Senior Product Manager at Buffer, on four best practices for implementing product analytics in your research workflow.
1. Start tracking metrics sooner rather than later
Diego highlights the importance of collecting data early in the product lifecycle, even when user numbers are low. He explains that "Setting up product analytics from the start allows you to continuously iterate and improve. It’s much easier to track progress if you start early.”
Early tracking establishes a baseline for user behavior, allowing teams to fine-tune what they measure, and iterate based on real data. This practice saves time and resources later, as it enables product teams to identify friction points and make improvements before issues escalate.
2. Define and validate hypotheses with data
While having a considered hypothesis helps guide meaningful product analysis, Diego thinks it’s crucial to have product analytics to validate these assumptions: "Product analytics lets you close the loop by showing whether your users actually can or do use the solution you built."
By tracking how users engage with specific features, product teams can validate their initial assumptions and make data-driven decisions, adjusting the product based on what users actually do, not just what they say.
3. Focus on key metrics, not everything
Tracking too much data can create confusion and make it harder to focus on what matters most, says Diego. Instead, he suggests honing in on the key metrics tied to your main hypotheses:
Collecting too much product analytics data is confusing. If you have a giant dashboard with many data sources, that implies that your question isn’t quite clear. Hone in on a handful of key metrics rather than trying to assess everything.
Diego Sanchez
Senior Product Manager at Buffer
Share
For example, when assessing Buffer’s Engage suite, Diego’s team tracked key performance indicators (KPIs) like the Activation Rate and Retention.
4. Be open to surprises
Diego’s experience with Buffer’s emoji picker feature is a powerful reminder that product analytics can reveal unexpected insights. Although this feature wasn’t central to the team’s core hypotheses about what features users would prioritize, it turned out to be highly popular among users:
"The emoji picker wasn’t related to any of our core hypotheses, but having good click tracking data led us to discover that it’s a key feature and delighter for our customers. We could then look at the feature and investigate further to learn what about it resonated with users, so we can replicate the effect"
Regularly reviewing analytics data, even on secondary features, can help identify what users truly value, leading to better product decisions and improvements.
3 Best product analytics tools for better product decision-making
1. Mixpanel: Best for user behavior tracking
G2 rating: 4.6/5 stars, based on 1,099 reviews
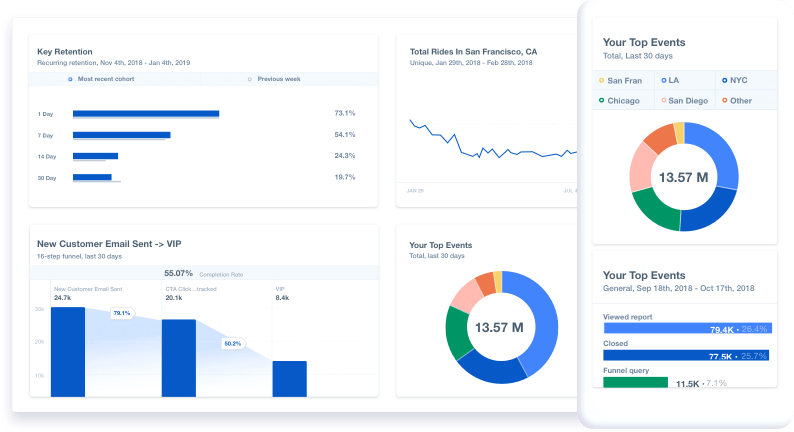
Mixpanel is a great tool for understanding user behavior in web and mobile applications. You can set up custom KPIs to track specific goals and milestone events like ‘profile created’ or ‘5+ messages sent.’ These insights help you identify where your product excels and where improvements might be needed.
Designed with product teams in mind, Mixpanel is particularly valuable for product-led growth strategies, providing the data and tools needed to analyze and enhance customer experiences.
Key features of Mixpanel include:
- Funnel analysis: Track user progression through conversion paths and identifies where users drop off
- Cohort analysis: Analyze user behavior over time to measure retention and engagement
- Lexicon: Organize and documents, events and properties for consistent and clear data
- Recurring Messages: Automate messages based on user behavior to drive specific actions
- In-Depth Data Analysis: Use machine learning to uncover insights and suggest product improvements
- SDKs and APIs: Provide tools for developers to stream data directly from digital products
Mixpanel pricing
Mixpanel offers a free plan for up to 20 million monthly events and a Growth plan starting at $28 per month for 10,000 events, scaling with usage.
2. Amplitude: Best for customer journey insights
G2 rating: 4.5/5 stars, based on 2,132 reviews
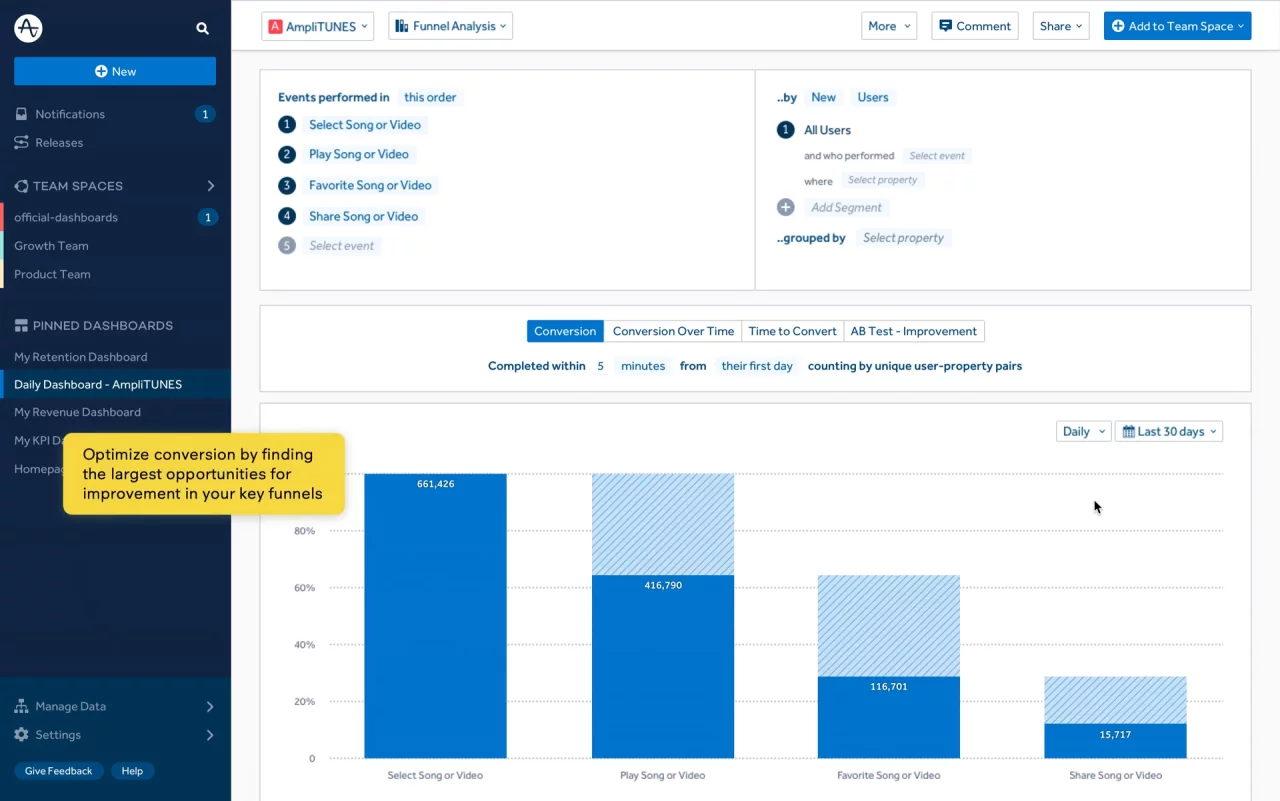
Amplitude tracks user interactions—like taps, swipes, and purchases—across apps and websites, analyzing millions of these data points to provide deep insights into user behavior. One of Amplitude’s key strengths is its ability to analyze every step of the sales funnel, from the moment a user first engages with the product to when they make a purchase.
Key features of Amplitude include:
- Event segmentation: Analyze specific user actions and behaviors within your product to understand what drives engagement
- Cohorts and audiences: Create and analyze groups of users based on shared traits or behaviors to target and improve user experiences
- Pathfinder: Visualize user journey paths and event sequences to see how users navigate through your product
- Automated reports: Access instant insights with industry-specific templates that help you quickly understand key metrics
- Real-time data processing: Get up-to-date insights on user behavior as it happens, allowing for quick adjustments and decisions
- Behavioral cohorts: Group users based on specific actions or traits to see how different segments interact with your product
Amplitude pricing
Amplitude’s Starter plan is free and includes essential features like product analytics, session replay, and unlimited feature flags. For teams needing more advanced tools, the Plus plan starts at $61 per month and includes features like advanced analytics, custom dashboards, and online support.
✨ Product tip
Maze integrates with Amplitude to target specific cohorts with in-product feedback requests and get insights from the right users at the right time.
3. Heap (by Contentsquare): Best for automatic data capture and analysis
G2 rating: 4.4/5 stars, based on 1,085 reviews
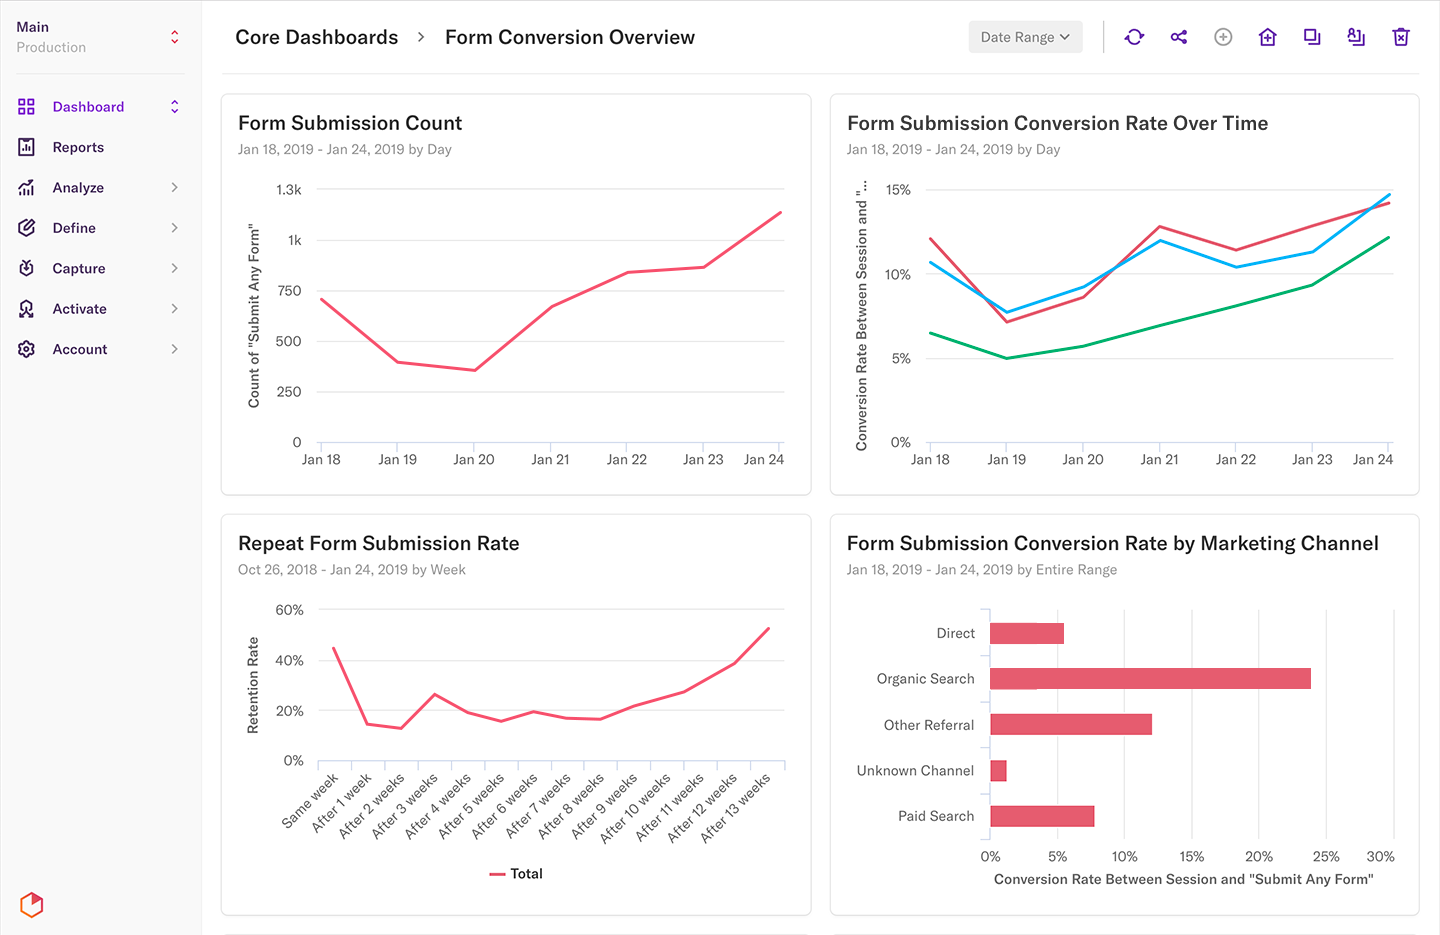
Heap, now part of Contentsquare, automatically captures every user interaction across your website and mobile apps without requiring manual event tracking. Heap stands out by offering auto-capture technology, which means every click, tap, and pageview is recorded from the start. This data collection provides a complete picture of user behavior, enabling more thorough analysis and insight generation.
Key features of Heap include:
- Event visualizer: Quickly see and understand user actions across your site without the need for manual tagging
- Behavioral data collection: Automatically capture all user interactions, providing a complete dataset for analysis
- Retroactive data analysis: Analyze past user behavior, even if you didn’t set up specific tracking in advance
- Segmentation and cohorts: Group users by specific behaviors or attributes to analyze their actions and outcomes
- Path analysis: Visualize user journeys to identify common paths and potential friction points
- A/B testing integration: Measure the impact of changes and experiments on user behavior seamlessly
Heap pricing
Heap does not list its prices publicly on its website. However, according to a Reddit user, in 2023, the paid plans were reported to cost between $2,500 and $3,000 per month for the first year.
Product analytics data: What’s next?
Product analytics often identifies issues, but understanding why these issues arise requires deeper research. To do this, you need a platform like Maze.
Maze’s comprehensive suite of user research methods makes finding the why behind product analytics metrics a breeze. Product analytics data highlights points of interest, and Maze helps you investigate them.
From Interview Studies and Feedback Surveys to Prototype, Mobile, and Live Website Testing—Maze’s research studies give you all the data you need to make more informed decisions. Plus, with ample integration options, you can easily connect Maze with your product analytics solution to streamline your product design and development workflow from start to finish.
Product analytics and UX research go hand in hand. Let user data guide your decisions to enable your team to build user-centered designs from the get-go.
Frequently asked questions about product analytics
What’s the difference between product management and product analytics?
What’s the difference between product management and product analytics?
Product management focuses on overseeing the entire lifecycle of a product—from ideation and development to launch and ongoing improvements. It involves strategy, decision-making, and ensuring the product meets user needs and business goals.
Product analytics tracks and analyzes how users interact with a product. It provides data-driven insights that help product managers make informed decisions about product features, performance, and user experience optimization.
How are product analytics metrics different from product metrics?
How are product analytics metrics different from product metrics?
Product analytics metrics specifically track user behavior and interactions within a product, such as feature usage, session duration, or bounce rates. These metrics help optimize the user experience.
Product metrics, however, are broader and can include business-focused KPIs like customer acquisition cost (CAC), revenue growth, or churn rate, which measure the product's overall performance and success in the market.

