


Not all research starts from scratch. Secondary research leverages existing data—from reports, studies, and industry insights—to answer key questions without running new experiments. It’s a go-to method for researchers, product teams, and UX professionals who need reliable information fast.
Below, we break down how secondary research compares to primary research, when to use it, how to find credible sources, and the best methods for analyzing data.
What is secondary research?
Secondary research is the practice of gathering insights from existing data sources rather than generating new data. It involves analyzing reports, industry publications, government statistics, academic studies, internal company data, competitor analysis, historical records, news archives, and public datasets to answer research questions.
In an episode of The Optimal Path podcast, Nick Stiles (User Researcher at IBM) sets out the appeal of secondary research:
Secondary research is an orienting tool for user researchers... It tells us what isn’t known already. It saves us time and money and lays the foundational understanding for any primary work that you will do.
Nick Stiles
User Researcher at IBM
Share
Examples of secondary research include meta-analysis, literature reviews, and systematic reviews, which synthesize available data to draw conclusions.
Secondary research is widely used in UX research, market analysis, and product development, where teams need to understand trends, validate decisions, or benchmark against competitors without conducting firsthand studies. Since the data is already available, secondary research is often faster and more cost-effective than primary research.
Secondary vs. primary research
When starting a research project, one of the first decisions you’ll make is whether to collect new data or use existing data. That’s the difference between secondary research and primary research:
- Secondary research: Uses existing data from reports, studies, and industry insights
- Primary research: Collects original data directly from sources through UX research methods
Here’s a quick breakdown of how they compare:
Secondary research | Primary research | |
|---|---|---|
Definition | Uses existing data from reports, literature reviews, and government agencies | Collects original data directly from sources |
Data sources |
|
|
Cost | More affordable—leverages available data instead of running new studies | Expensive—requires recruitment, surveys, and analysis |
Time investment | Less time-consuming—data is already collected and ready for data analysis | Takes longer—requires research design, data collection, and interpretation |
Data control | Limited control—data may not fully match your research needs | High control—tailored to your research question |
Secondary research vs. desk research
Secondary research and desk research are two terms often used interchangeably—but while they both involve working with existing data, they differ in scope and depth:
- Secondary research involves a deep UX research process, incorporating meta-analyses, systematic reviews, and data synthesis
- Desk research is a form of secondary research, but it's more limited—it focuses on gathering readily available information without extensive data analysis
Here’s a quick comparison:
Secondary research | Desk research | |
|---|---|---|
Definition | Uses existing data sources to analyze trends, validate research hypotheses, and inform decisions | Collects available data from reports, articles, and online sources |
Scope | Includes academic journals, government agencies, and industry reports | Limited to easily accessible sources like Google Scholar, news archives, and market reports |
Research methods | Can involve systematic reviews, meta-analyses, and demographic studies | Mostly involves literature reviews, desk research methods, and keyword searches |
Depth of analysis | Can combine multiple datasets and perform quantitative and qualitative research | Provides a broad overview with minimal data collection |
Use case | Helps answer research questions, conduct market research, and validate previous research | Serves as a starting point for a research project, giving quick background information |
When to use secondary research
In most cases, researchers use secondary research as a starting point before deciding whether additional primary research is needed.
Use secondary research when:
✅ You need cost-effective insights: Gathering primary data through surveys, focus groups, or experiments can be time-consuming and expensive. Secondary research uses academic journals, government agencies, and industry reports to provide insights without additional costs.
✅ You’re in the early stages of a research plan: Before designing a research methodology, secondary data helps define the research question, refine research hypotheses, and identify gaps that may require primary research.
✅ You need historical or large-scale data: Government reports, market research studies, and demographic datasets provide long-term trends and large-scale insights that would be difficult to collect independently.
✅ You’re benchmarking against competitors: Industry reports, case studies, and previous research help analyze competitors’ strategies, identify best practices, and uncover market research trends.
✅ Your research doesn’t require firsthand data: If existing data already answers your research needs, collecting new data may not be necessary.
When secondary research may not be enough:
❌ If your research question requires original data (e.g., specific customer feedback, user behavior studies)
❌ When secondary sources are outdated, biased, or lack relevance to your research study
❌ If existing datasets don’t align with your target market or research objectives
Where can you gather secondary data?
Secondary data sources fall into two categories: internal sources and external sources.
Internal sources
Internal data comes from within your company. It includes information from past research studies, analytics, and customer research that can be repurposed to answer new research questions. This type of existing data is often more specific to your product and users, making it highly valuable for UX research and product development.
Some examples include:
- User analytics and behavioral data: Data from user analysis tools like Google Analytics, Mixpanel, or Maze can reveal how users interact with a product, where they drop off, and what features they engage with most
- Customer feedback and support tickets: Previous support queries, chat transcripts, and NPS surveys provide insights into recurring pain points and user expectations
- Previous UX research and usability testing reports: Findings from past focus groups, usability tests, and A/B tests can inform future research projects without redoing the work
- Sales and CRM data: Information from platforms like Salesforce or HubSpot can highlight user segments, feature adoption, and common objections raised by potential customers
- Social media and community discussions: Internal Slack channels, user communities, and social media interactions often provide qualitative insights into user sentiment and target market needs
External sources
External data comes from outside your organization and includes peer-reviewed research, industry benchmarks, and public datasets.
Some examples include:
- Academic journals and research publications: Platforms like Google Scholar, ResearchGate, or ACM Digital Library provide peer-reviewed studies on human-computer interaction, usability, and behavioral psychology
- Industry reports and benchmark studies: Research firms like Nielsen Norman Group, Baymard Institute, and Gartner publish qualitative research on UX best practices, product usability, and emerging trends
- Government and public datasets: Census data, economic reports, and demographic studies from sources like data.gov or Eurostat can help UX researchers understand broader user demographics
- Competitor and market research reports: Desk research on competitor case studies, whitepapers, and user interviews published by other companies can highlight industry benchmarks and best practices
- Social science and behavioral studies: Research on cognitive biases, accessibility, and digital behavior from institutions like MIT Media Lab or Stanford’s HCI Group helps UX teams design more intuitive interfaces
6 Secondary research methods
Like any kind of user research, the right research method depends on your research question and available data sources. Here are six ways to use secondary research.
1. Statistical analysis
Statistical analysis helps you find patterns, relationships, and trends in existing data, allowing you to validate hypotheses. It’s commonly used when analyzing market research reports, usability studies, or behavioral datasets to support design decisions.
Nick Stiles, User Researcher at IBM, highlights the role of statistical analysis in research:
I’m running experiments, I’m maybe doing statistical analysis of some kind, and I’m trying to get at objective nature and objective reality.
Nick Stiles
User Researcher at IBM
Share
There are two main types of statistical analysis:
- Descriptive statistics summarize data using measures like mean, median, mode, and standard deviation to explain trends in user behavior
- Inferential statistics help you draw conclusions from a dataset, using methods like hypothesis testing, regression analysis, and correlation analysis to predict outcomes
Statistical analysis is useful for UX research when working with large datasets. Here are a few examples:
✅ Prototype testing: Analyzing task completion times from previous usability studies to determine which design is most efficient
✅ A/B test data interpretation: Using hypothesis testing to confirm whether a button color change significantly improved conversions
✅ Survey data analysis: Running correlation analysis on past user feedback to check if higher usability ratings align with longer session durations
✅ User behavior tracking: Applying frequency distributions to analytics data to see where users drop off in a checkout flow
2. Content analysis
Content analysis is a qualitative research method used to systematically analyze text, images, or other forms of communication to identify patterns, themes, and meanings.
In UX research, content analysis helps make sense of user feedback, survey responses, interview transcripts, and product reviews by categorizing and quantifying qualitative data. One way to structure findings in content analysis is through thematic analysis, where you categorize insights into recurring themes.
For example, if you have hundreds of open-ended survey responses about a product’s usability, content analysis allows you to break down feedback into recurring themes—like navigation issues, feature requests, or accessibility concerns—so you can make informed design improvements.
Traditionally, content analysis requires manually reading through transcripts, coding responses, and categorizing themes—a time-consuming process. With Maze AI, you can upload interview recordings, survey responses, or usability transcripts and get instant transcripts, summaries, and key themes.
Maze also uses sentiment analysis to assess how users feel about specific topics. Instead of spending hours coding and sorting through data, you get structured takeaways in seconds, making it easier to track trends and make informed design decisions.

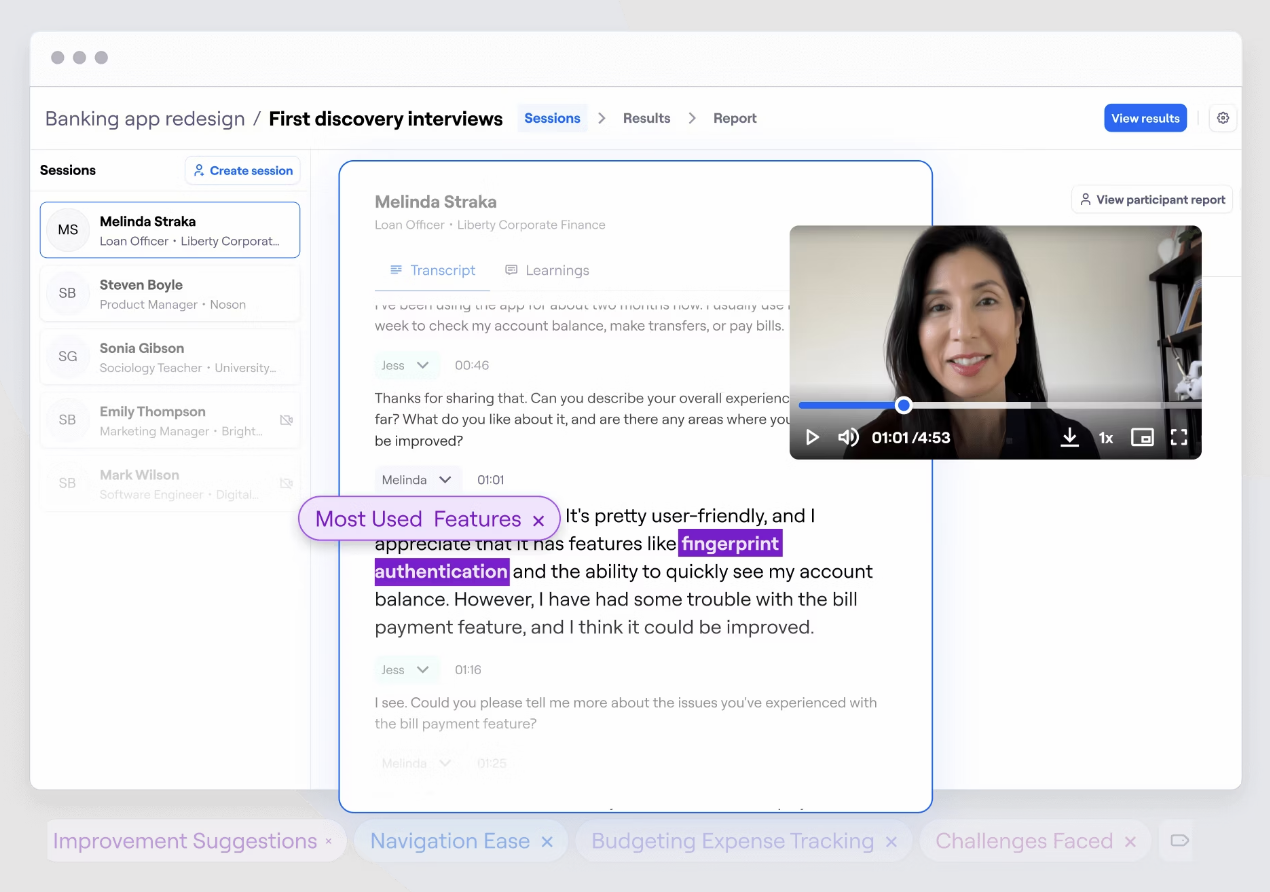
Easily tag themes and categorize insights with Maze Interview Studies
💡 Product tip
Get started with this free sentiment analysis template from Maze
3. Literature reviews
A literature review helps UX researchers explore previous studies, industry reports, and academic work to understand what’s already been studied and where gaps remain.
For example, if a team is studying mobile navigation patterns, a literature review of academic studies on cognitive load, past usability reports, and industry benchmarks can reveal what’s already known about the topic.
This allows UX teams to refine their research, ensuring they ask the right questions and uncover new insights rather than confirming what’s already documented.
A lot of people in UX research are used to doing secondary research to gain an understanding of all the research that's been done in the space thus far. 'Where's my niche? Where can I aim my primary research to contribute to the broader knowledge and the broader understanding of the field?'
Nick Stiles
User Researcher at IBM
Share
4. Case studies
Case studies help UX teams move beyond abstract data by showcasing real-world applications of research findings. They highlight successes, failures, and key learnings from past projects, making research insights more relatable and actionable.
Nick Stiles emphasizes the importance of combining different sources to build a compelling research narrative.
You're trying to piece together the truth by looking at corroborating evidence in verifiable evidence. You're trying to get a picture of the space from multiple angles.
Nick Stiles
User Researcher at IBM
Share
This is exactly what case studies do—they bring together qualitative and quantitative findings to paint a fuller picture.
So how can case studies help in UX research?
✅ Making research persuasive: Stakeholders are more likely to act on research when they see concrete examples instead of just raw data
✅ Connecting data to design: Case studies translate research findings into real product decisions, showing how insights improve user experiences
✅ Building institutional knowledge: Well-documented case studies serve as internal resources, preventing teams from repeating past mistakes or overlooking valuable insights
5. Comparative analysis
Comparative analysis is a research method that involves examining different sources of information to identify patterns, similarities, and differences. It helps researchers make informed decisions by cross-referencing data from multiple perspectives rather than relying on a single source.
Nick highlights the role of comparative analysis in user research, particularly when working with secondary data. He explains that user researchers pursue two types of truths:
- The journalistic truth: Piecing together reality by looking at corroborating and verifiable evidence
- The social science truth: Conducting experiments and statistical analysis to uncover objective reality
These two things are complementary, and I feel like we have ignored that journalistic truth, yet we do it all the time with secondary research.
Nick Stiles
User Researcher at IBM
Share
An example of comparative analysis in action is Nick’s work in FinOps, a cloud cost management discipline. When he joined IBM’s discussions on the topic, he noticed that different teams had conflicting definitions of the topic. Instead of conducting new research immediately, he compared multiple sources, including:
- Internal IBM reports
- Academic research
- Industry blogs and articles
- Online community discussions on Reddit and LinkedIn
By analyzing these diverse perspectives, he was able to identify common themes and resolve inconsistencies, leading to a shared understanding of what FinOps meant within the team. This helped IBM align its approach, avoid redundant debates, and focus on actionable insights moving forward.
6. Meta-analysis
Meta-analysis and comparative analysis may initially seem similar since both involve reviewing multiple sources, but they serve different purposes:
- Comparative analysis looks at different sources to identify patterns, similarities, and differences in findings, helping researchers understand diverse perspectives. However, it does not statistically combine results.
- Meta-analysis goes a step further—it’s a quantitative method that aggregates numerical data from multiple studies to calculate an overall effect, size or trend. This method is particularly useful when individual studies have small sample sizes or conflicting results.
For example, suppose three separate studies examine the impact of a UX design change on user engagement. One study reports a 5% increase, another shows a 7% improvement, and the third finds no effect.
Instead of relying on individual results, a meta-analysis statistically combines these findings to determine if the design change has a significant overall effect. If the combined analysis shows an average increase of 6% with strong statistical significance, this offers a clearer conclusion than looking at each study separately.
How to conduct secondary research in 7 steps
Secondary research is a good research strategy when you have the resources available to conduct it effectively. Here’s your step-by-step guide:
- Define your research objectives: Clearly outline what you’re trying to achieve. What questions are you trying to answer? What insights are most critical?
- Identify reliable sources: Search for trusted materials such as academic journals, industry reports, government publications, internal company documents, and respected blogs or forums. Using credible sources increases the validity of your findings.
- Gather data from multiple perspectives: Don’t rely on just one source. Combining insights from different materials allows you to confirm patterns and get a well-rounded understanding.
- Evaluate source credibility: Assess the reliability of each source. Consider the author’s qualifications, publication date, and the source’s reputation. Using current and reputable sources ensures your conclusions are based on accurate information.
- Organize and categorize findings: Group related data under categories or themes, such as user preferences, market trends, or product performance. This makes it easier to spot patterns and draw meaningful conclusions.
- Summarize insights and identify gaps: Condense the key takeaways from the data and note any areas where information is missing or unclear. Identifying these gaps can guide future research efforts and help you address overlooked issues.
- Document your process: Keep track of the sources you used, how you collected and analyzed the data, and any criteria for including or excluding information. This transparency strengthens your findings and makes it easier for others to review and understand your approach.
The advantages and disadvantages of secondary research
While secondary research saves time and resources, it also comes with limitations that you need to navigate carefully.
Advantages | Disadvantages |
|---|---|
|
|
The advantages of secondary research
- Uses existing knowledge: Instead of reinventing the wheel, secondary research builds on what’s already known, helping teams move faster
- Refines primary research: When you identify knowledge gaps early, you can focus primary research on uncovering new insights rather than confirming what’s already been studied
- Connects multiple perspectives: Comparing academic studies, industry reports, and user discussions gives a well-rounded view of a topic, strengthening decision-making
- Speeds up internal alignment: When teams debate fundamental questions, secondary research can establish a shared understanding, reducing back-and-forth discussions
Doing the secondary research leads to more pointed questions in your primary research, more targeted questions, more targeted objectives.
Nick Stiles
User Researcher at IBM
Share
The disadvantages of secondary research
- Limited control over data quality: Since secondary research relies on existing sources, the accuracy, relevance, or methodology of the data might not always meet your standards
- Potential for outdated information: Industry trends, user behaviors, and market conditions change rapidly, meaning older studies or reports may not reflect the current landscape
- Lack of specificity: Secondary data is often collected for broad purposes, so it might not directly answer your specific research questions
- Risk of bias in sources: Reports from companies, industry blogs, or thought leaders may have inherent biases, making it crucial to cross-check findings with multiple sources
- Gaps in context: Without knowing the full methodology behind a study, it can be difficult to interpret findings correctly or apply them accurately to your research
Analyze secondary research with Maze
Whether you're identifying trends, validating assumptions, or refining your research focus, secondary research lays the groundwork for smarter, more efficient strategies.
Maze structures UX research by allowing teams to test prototypes, run usability studies, and collect user feedback in one place. Alongside analyzing existing research data, you can use Maze to validate findings with real users and conduct studies to fill research gaps; gathering a fuller understanding of your users.


Frequently asked questions about secondary research
What are three secondary research sources?
What are three secondary research sources?
Three common sources of secondary research are:
- Academic research: Studies, journal articles, and literature reviews from universities and research institutions
- Industry reports: Market research reports, white papers, and trend analyses from firms like Gartner or Statista
- Public data: Government reports, census data, and regulatory filings
Is secondary research the same as desk research?
Is secondary research the same as desk research?
No, secondary research and desk research are not exactly the same. Desk research is a type of secondary research that involves collecting information from readily available sources, such as online reports, industry publications, and internal company data. Secondary research is a broader term that includes desk research but also covers academic studies, government reports, and previously conducted surveys. It can involve more in-depth analysis, like comparative studies or meta-analysis.
What are some desk research methods?
What are some desk research methods?
Qualitative desk research includes content analysis, discourse analysis, and narrative analysis. Quantitative desk research includes statistical analysis, meta-analysis, and trend analysis.