


TL;DR
Confidence intervals give UX researchers a statistically reliable way to generalize findings from a small sample to the entire user base. They involve combining a point estimate (like a mean or proportion) with an upper and lower bound and a chosen confidence level (often 95%) to estimate where the true score of an entire population should fall.
Confidence intervals can be narrow or broad. Narrow intervals indicate precision and support high-stakes decisions, while broader intervals are useful for early exploration.
Calculating confidence intervals involves gathering representative data, finding the mean or proportion, measuring variability, and applying the correct formula. In practice, confidence intervals help validate results, reduce bias, and guide better product decisions.


What are confidence intervals?
A confidence interval is a calculated range of values that estimates where the true score of an entire population (in most cases, your product user base) is likely to fall. This is based on the results of a smaller sample, along with a stated probability that this estimate is correct.
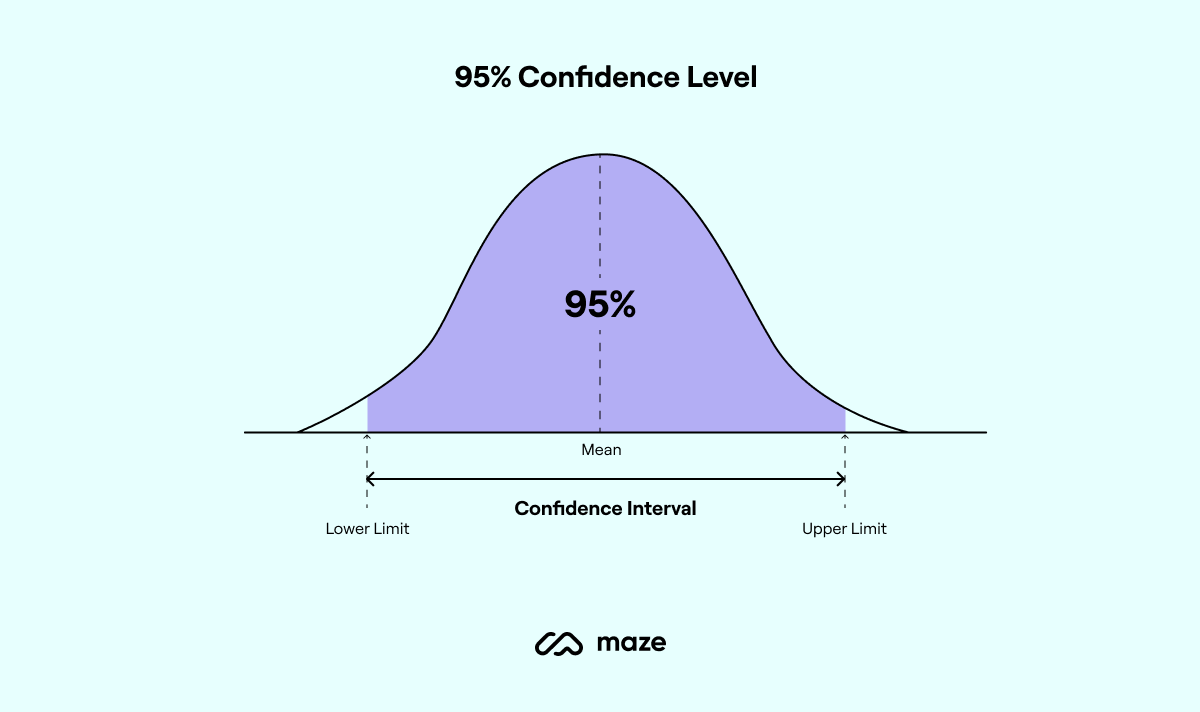
In UX research, confidence intervals are made up of two parts:
- The intervals (the upper and lower bounds around your estimate)
- The confidence level (the probability that your sample results reflect the true population outcome)
This means if you run a usability test and calculate a 95% confidence level for task completion time, you can be 95% sure the true average for all users falls between the confidence interval you calculated.

When calculating confidence intervals, it's important not to confuse them with confidence levels. Let’s take a closer look.
What’s the difference between confidence intervals and confidence levels?
Let's look at confidence intervals and levels in more detail to clarify the differences.
- Confidence intervals are a range of values that likely contain the true average (or mean) of an unknown population parameter
- Confidence levels tell you how sure you can be of finding the true value within a confidence interval
The biggest difference is that confidence intervals are probabilistic; they tell you the likelihood that your findings remain accurate when applied to a larger population—there's no guarantee that the interval will include the true mean, but there's a good chance it does.
This chance depends on the confidence level—if you're 95% confident the true mean is within the range, there’s still a 5% chance that it’s not.
Let’s say you measure checkout time on an e-commerce site using 100 users and find an average of eight minutes. A 95% confidence interval might show the true average lies between 7.5 and 8.5 minutes.
The confidence interval gives the range, while the confidence level tells you how often repeated studies would capture the true mean. For instance, an 80% confidence level means 8 out of 10 repeated samples would produce a similar interval.
💡 Tip: The narrower your confidence interval, the higher your confidence level
Confidence intervals in UX research
When applied to UX research, confidence intervals help teams assess how accurately their sample findings reflect the entire product user base. Instead of reporting results as a single average, intervals show the range you can expect across all users.
The importance of confidence intervals in UX research
Confidence intervals make UX data analysis more reliable. They indicate the variability of your mean value if you repeat the study. In doing so, these intervals show a realistic representation of your results, and how your mean will fluctuate within the population.
For UX teams, this means:
- Estimating true values: UX researchers work with small sample sizes because it’s not realistically possible to study all users. Confidence intervals predict how accurately your findings from a small dataset apply to the entire population, revealing an accurate representation of real users. The interval also prevents overgeneralization and cognitive biases based on average values, since the range of values shows how user behavior differs.
- Prioritizing user needs: Confidence intervals acknowledge that users don’t behave identically and that there’s variation in how users perform certain actions. UX teams can better understand and prioritize user needs based on this variability. Confidence intervals paint a picture of how all users experience or interact, ensuring you’re building and implementing solutions that work for everyone.
- Assessing reliability: A narrow confidence interval means your estimate is more precise and reliable. You can add more credibility to your research by adding this interval. It shows stakeholders that you’re not relying on an average point estimate. Instead, your findings are based on a range of data points and apply to a wider population.
- Guiding decision-making: Another huge benefit of finding confidence intervals for UX research is to make more informed, data-backed decisions. You can capture a range of user behavior and responses to any decision. As a result, you can make more nuanced UX design choices based on the breadth of user responses to every product and update.
The bottom line: Confidence intervals offer clarity into how applicable your findings are to your entire user base. You can apply this understanding to make strategic decisions and improve the user experience.
Real-life example of intervals applied to a usability test conducted
A well-documented case from Nielsen Norman Group shows how confidence intervals directly affect usability test outcomes. In one study, researchers measured a 40% task success rate but found the 95% confidence interval ranged from 0% to 80%.
With such a wide range, the results were inconclusive. The interface could be failing almost everyone or working well for most users, leading to completely different design decisions.
When the team increased the sample size, the confidence interval narrowed to 35% to 45% for the same task. This narrower range provided an actionable insight: the design needed improvement, but researchers could now estimate the true success rate with confidence and back their recommendations with evidence.
This example illustrates the importance of confidence intervals in UX research, and how the width of the confidence interval determines the reliability of your findings. Wide intervals highlight uncertainty and the need for more data, while narrow intervals build trust and support decisive product choices.
How to calculate confidence intervals in 6 steps
Confidence intervals may look complex at first glance, but in practice, they follow a repeatable process. You collect data from a representative sample, calculate its average or proportion, measure how much results vary, and then apply a statistical formula to estimate the range for your entire user base.
Here’s a quick overview of the process before we break it down step by step:
- Gather your data: Recruit a representative sample of users
- Find the point estimate: Calculate the sample mean (for averages) or proportion (for completion rates)
- Measure variability: Compute the standard deviation (for means) or account for binomial variation (for proportions)
- Set your confidence level: Usually 90–99%, with 95% most common
- Apply the formula: Plug values into the correct formula (t-interval for means, Wilson/binomial for proportions)
- Interpret the range: Explain what the upper and lower bounds mean for your entire user base
1. Gather your data from the sample
Start by collecting data from a random sample of participants that represents your product’s user base. Statisticians emphasize random sampling because it ensures your sample statistic (like a mean or proportion) is an unbiased estimate of the true population parameter. You can use any quantitative research method to gather data on your research subject (bear in mind that you can’t calculate confidence intervals for qualitative information).
The most important point to note in step #1 is building your research sample. You want to choose participants that represent your overall user base, instead of focusing on any specific segment.
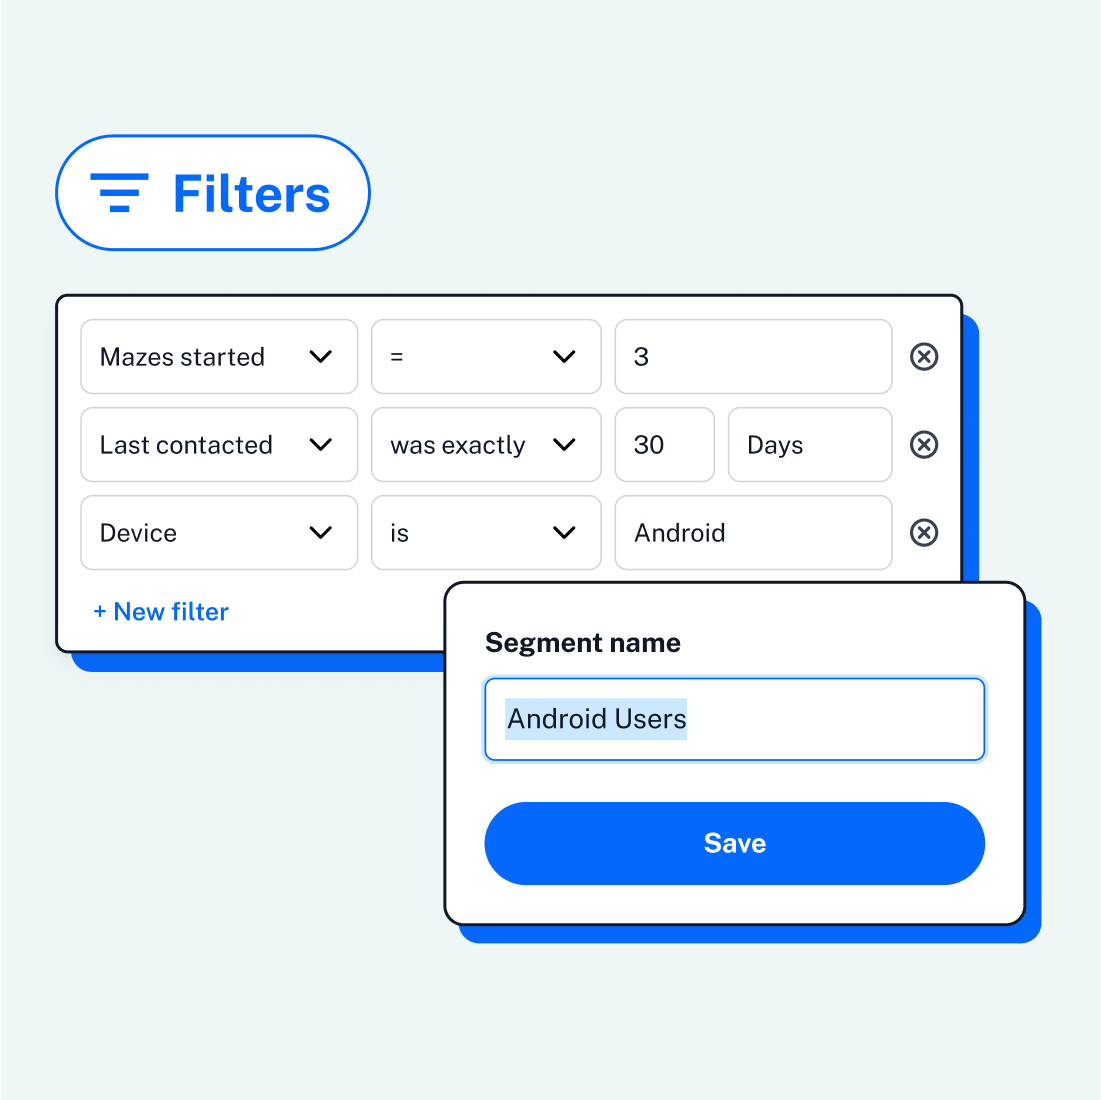
Platforms like Maze Panel make it easy to recruit research participants for your study, and Maze Reach enables you to build a database of testers that you can return to—this can be helpful in validating your confidence level.

Once you’ve got your testers, it’s time to run the research. There are ample user research methods and ways to get customer insights. Consider your needs and choose a UX research method that gets the quantitative data you need, such as usability testing or user surveys.
2. Calculate your sample mean
After collecting your data, it’s time to find the sample mean (x̄) for continuous measures (like time on task). This is the central sample statistic around which your confidence interval will be built. In UX research, this might mean summing all task times and dividing by the number of participants.
If you’re working with a proportion (e.g., completion rates), you’ll calculate p̂, the proportion of successes in the sample. Both serve as the starting point for statistical inference.
You’ll use this figure when calculating the confidence interval for larger samples—it represents the average experience or response of your sample group.


3. Calculate variability (standard deviation and standard error)
Now, you need to calculate the standard deviation (s) if the population standard deviation (σ) is unknown, which is almost always the case in UX. The standard deviation explains how spread out the scores are around the mean, helping to understand the variability in your data.
To do this, you have to subtract the sample mean (x̄) from individual scores/responses and write the square root of the difference for each data point. Then, add all the squared differences and divide this total by the number of scores minus one (N-1) to find your standard deviation (s).


From here, derive the standard error of the mean:

The standard error reflects the variability of your sampling distribution, letting you estimate how close your sample mean is likely to be to the true population parameter.
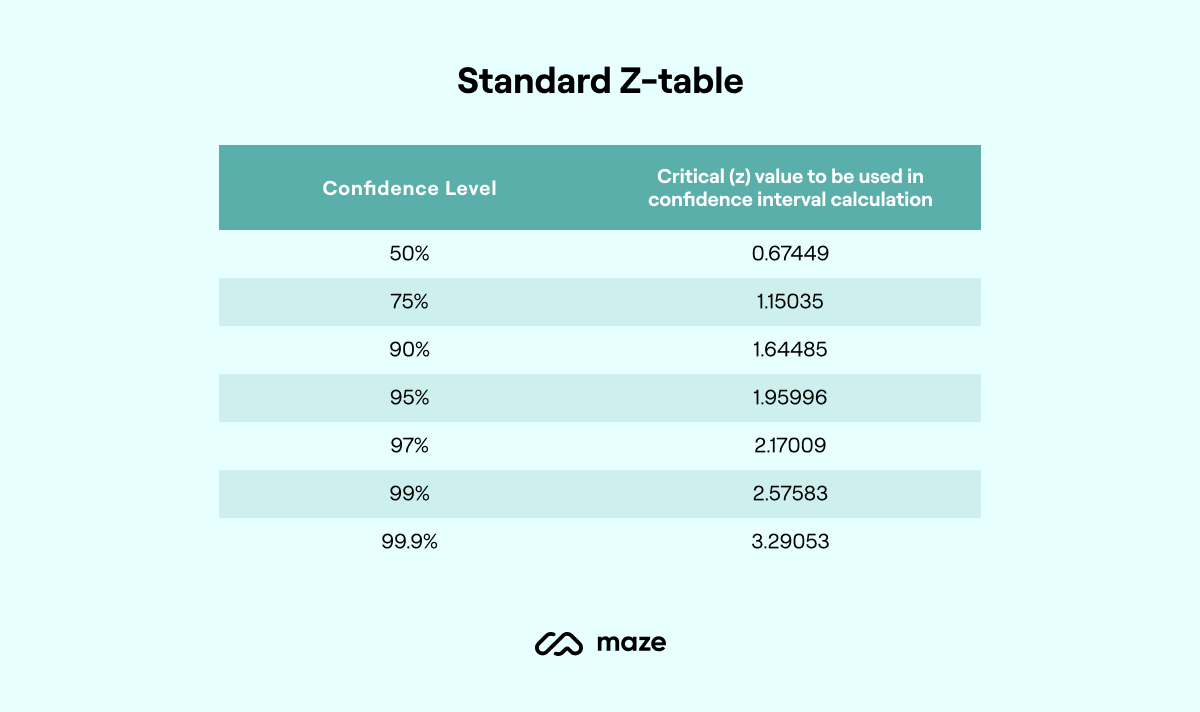
4. Find the z-score for your confidence level
The next step is to choose your preferred level of confidence (typically between 90% and 99%) and find its corresponding z-score value. You’ll find this value in a standard z-table. For example, a 90% confidence level corresponds to a z-value of about 1.645.

5. Plug your results into the confidence interval formula
You’re almost at the summit of the math mountain we’ve just climbed! Now, it’s time to put all these values in the formula to calculate the confidence interval.

- x̄ is your sample mean
- z is your z-score
- s is your standard deviation
- n is your sample size
This produces the range of plausible values (lower and upper bound) for your true population parameter. For proportions, use a binomial-based method (often the Wilson score interval).
6. Interpret your findings in relation to your study
The final step is to interpret your results and contextualize the confidence interval within your research.
For example, by now you might know that it takes six–eight minutes on average to complete the checkout process on your product, with a 95% confidence level. But you also need to communicate this finding in a clear and meaningful narrative.
Here’s what you need to know to effectively convey the results:
- Explain the confidence interval by clarifying what the upper limit (X) and lower limit (Y) mean. This means if you applied the scope of your research to a larger sample size, you'd get the true mean between X and Y.
- Clarify what the confidence level denotes. It’s the percentage value of how certain you are of finding the true mean within the confidence interval.
- Note whether results reach statistical significance if you’re also doing hypothesis testing (e.g., comparing groups with a t-test and reporting a p-value and effect size).
Remember to document these findings for every research project and store them in a research repository for future reference.
What’s the ideal confidence interval in UX?
In UX research, 95% confidence intervals are the most common standard. A 95% means that if you repeated the same study many times, the true population value would fall inside your reported range in 95 out of 100 cases. This balance between rigor and practicality makes 95% the go-to choice for most usability studies.
However, there’s no single ‘ideal’ confidence interval for every situation. The right interval depends on the context of your study and the stakes of your decision. In some cases, you’ll want a smaller, narrower interval for precision; in others, a larger interval is acceptable to capture early patterns without heavy investment.
Let’s consider when it’s ideal to have a smaller and a larger confidence interval.
You need a smaller confidence interval when…
A smaller confidence interval gives you a narrower range of values that contain the mean value. This indicates higher confidence in the accuracy of the estimate.
For example, a confidence interval of 78-82% gives just a 4% range, which means researchers are confident the true mean value is between the respective upper and lower limit. In contrast, a confidence interval of 70-90% has a 20% variance, so it is less precise and shows lower confidence.
A smaller confidence interval is good when you want to:
- Make high-stakes decisions: You want to minimize the risk when making a big decision like a feature revamp or UI overhaul—a smaller interval gives you a more precise value to make these decisions with minimal risks
- Benchmark performance: You can get a more accurate assessment of your product against competitors when analyzing key features
- Test mature products: Confidence intervals also help when making subtle changes to a mature product—it’ll show you the relatively minor but crucial impact on users
You need a larger confidence interval when…
A large confidence interval is broader and suggests lower confidence in the accuracy of the interval estimation. However, it’s still useful in different scenarios in UX research:
- Early-stage product design: When you’re conducting exploratory research, you can use a larger confidence interval to identify the overall trends and user preferences
- Iterative testing approach: You can rely on a larger interval to make incremental changes in an iterative design process and conduct precise testing in later stages
- Broad user research: If you want a broader understanding of user expectations, you can get meaningful insights from a large interval without too much precision
When should you use confidence intervals in UX?
UX researchers leverage confidence intervals for making design decisions based on user data—intervals can eliminate guesswork and give you a realistic estimate of your population to make informed product decisions.
Alongside UX, confidence intervals are used across the board for different business needs, such as:
- Marketers expecting a precise estimate of leads generated from an ad campaign
- Product designers estimating whether a new feature would resonate with users
- Customer service teams evaluating the effectiveness of new support strategies
Let’s face it: you can’t study every user as a part of a research survey or interview. Since it isn’t always possible to study a large group of users, due to time and budget constraints, product teams rely on confidence intervals to see how their findings from a small sample may apply to the overall user base.
In the context of UX research, confidence intervals present more accurate data to inform design roadmaps, build reliable UX reports, and make decisions.
Validate your research findings en masse
Calculating confidence intervals is an intimidating task, but it’s critical to the reliability of your research. Being able to effectively estimate the results of a wide user base helps you validate your research at scale, without the need for huge budgets or endless time.
If you’re ready to calculate confidence intervals, kick-start your next research study with Maze to find participants effortlessly.
Reach allows you to conduct a highly targeted search with 400+ filters to find ideal candidates aligned with your research theme, then send personalized invites and manage all participants in a database—like a CRM for your UX research.
You can then use Maze’s suite of research methods to conduct your research—whether it’s usability testing, prototype testing, user surveys, or more—to start calculating confidence intervals and understanding the reliability of your research.


Frequently asked questions about confidence intervals
What is the ideal confidence interval in user research?
What is the ideal confidence interval in user research?
The ideal confidence interval in user research is typically a 95% confidence interval, which balances rigor and practicality. That said, there’s no single “ideal” interval, narrower ranges are best for high-stakes or mature product tests, while broader intervals can be acceptable in exploratory or early-stage research.
How is a confidence interval different from a margin of error?
How is a confidence interval different from a margin of error?
A confidence interval is the full range of values likely to contain the true population result (for example, 70–80%). The margin of error is half the width of that range, the amount you add or subtract from the observed score to get the interval (e.g., a 75% success rate ± 5% margin of error = a 70–80% confidence interval).
What is the purpose of confidence intervals?
What is the purpose of confidence intervals?
The purpose of confidence intervals in UX research is to:
- Increase your research’s validity, reliability, and credibility
- Validate the findings from a small sample for a larger population
- Prevent overgeneralization and rely on hands-on data about user needs
- Make strategic design choices based on actual data on user preferences
What is a 95% confidence interval?
What is a 95% confidence interval?
A 95% confidence interval means you’ll find the true mean within the given range 95 times out of 100 if you conducted the same study with different samples.