


User Research
How to choose a user research platform for your team
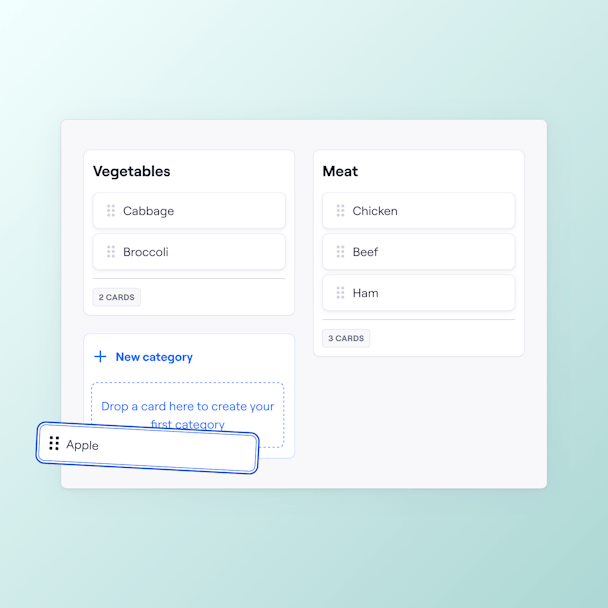
Test assumptions with Open or Closed card sorting tasks to see how your users group information. Helping you avoid unnecessary reworks and making UX your competitive edge.
With Maze, your results turn into visual analytics instantly—showcased as agreement rates, a similarity matrix, and an agreement matrix to speed up your time to insight.
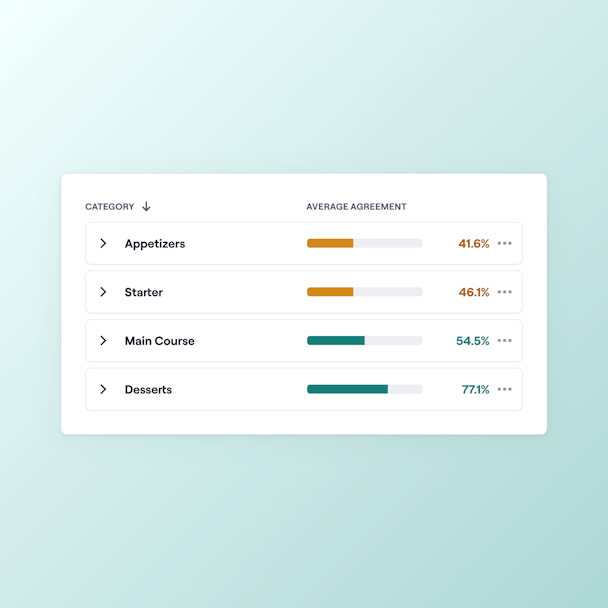
Discover the percentage of users who placed a card in a certain category.
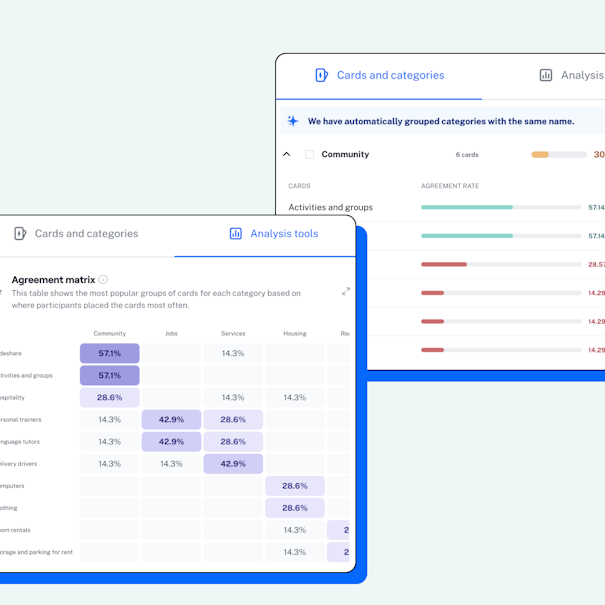
Save time manually piecing data together. Maze automatically merges categories with the same name.
Visualize trends as this matrix clusters cards under each category based on their highest agreement rates.
Evaluate the relationship between card pairings with this visualization.
Share your key learnings with our laser-focused card sorting slide in a ready-made report. Automatically collate categories with high agreement rates, popular cards, one-offs, and leave room for your matrix visualizations.
In poker, you should keep your cards close to your chest. In product, keep them close to your users to make the right decisions:
Does Maze support open, closed, and hybrid card sorting?
Maze lets you run both open and closed card sorts, so you can test how users group information freely or into set categories. Hybrid card sorting is not yet supported, but let us know if it's something you'd like to see.
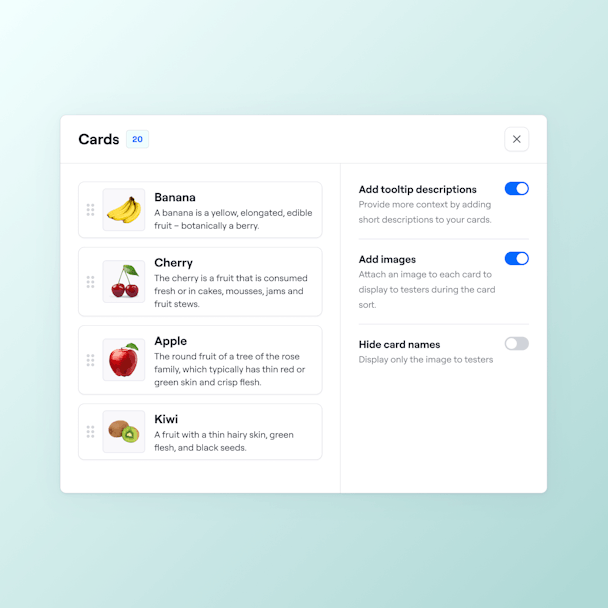
Can I include images on cards to test visual grouping instead of just text?
Yes! Maze supports image cards. Just toggle “Add images” in the card editor and upload JPG or PNG files to enable your participants to group pictures instead of only text.
How many participants do I need to run an effective card sort study?
Maze recommends testing with at least 30 participants for unmoderated card sorts and 5–10 for moderated ones, so you’ll get solid, actionable insights without over-recruiting.
How are card sorting results presented in Maze?
Maze presents card sorting results in your dashboard with agreement and similarity matrices, dendrograms, and clear visual summaries that highlight how participants grouped cards. You can export the results and share them with teammates, making it easy to review patterns, preferred groupings, and category trends.