User insights are everywhere—buried in reports, spread across multiple tools, hidden in Slack conversations, stored in your UX team’s minds. So when it comes to making decisions, wading through all the data to find relevant insights can feel impossible.
Atomic research changes that. It turns big amounts of data into small, reusable ‘research nuggets.’ These nuggets are clear, easy to share, and actionable.
Let’s explore the evolution of atomic research, applications in UX, and how to store (and share) those all-important research nuggets.
What is atomic research in UX?
Atomic research involves breaking down user insights into their smallest, most basic components—similar to atoms in chemistry. You can then use these research nuggets throughout product development to spread understanding and inform decisions.
Developed by Daniel Pidcock, this approach allows researchers to gain a granular and nuanced understanding of user behavior, preferences, and motivations.
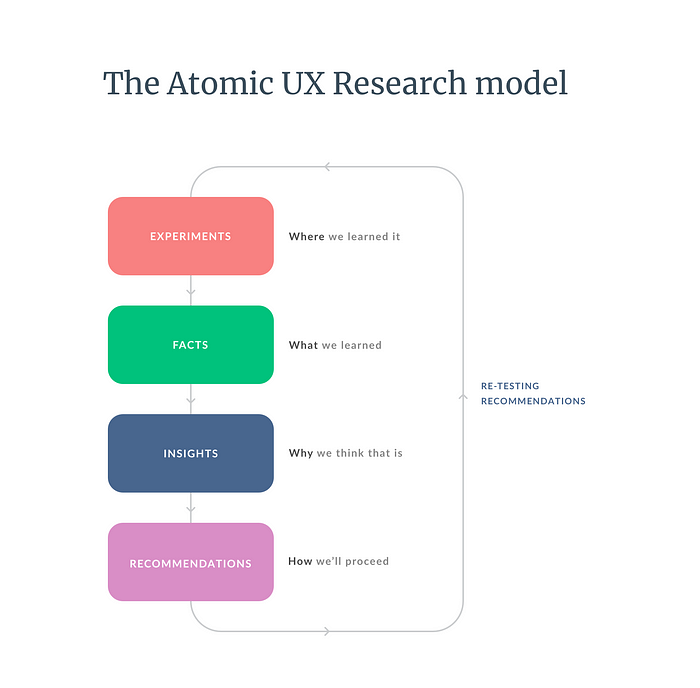
According to Daniel, atomic research is based on:
- Experiments: “We did this…”
- Facts: “And we saw this…”
- Insights: “And this made us think…”
- Conclusions: “Therefore, we will do that”
(We’ll cover this process in detail later on–jump ahead now.)
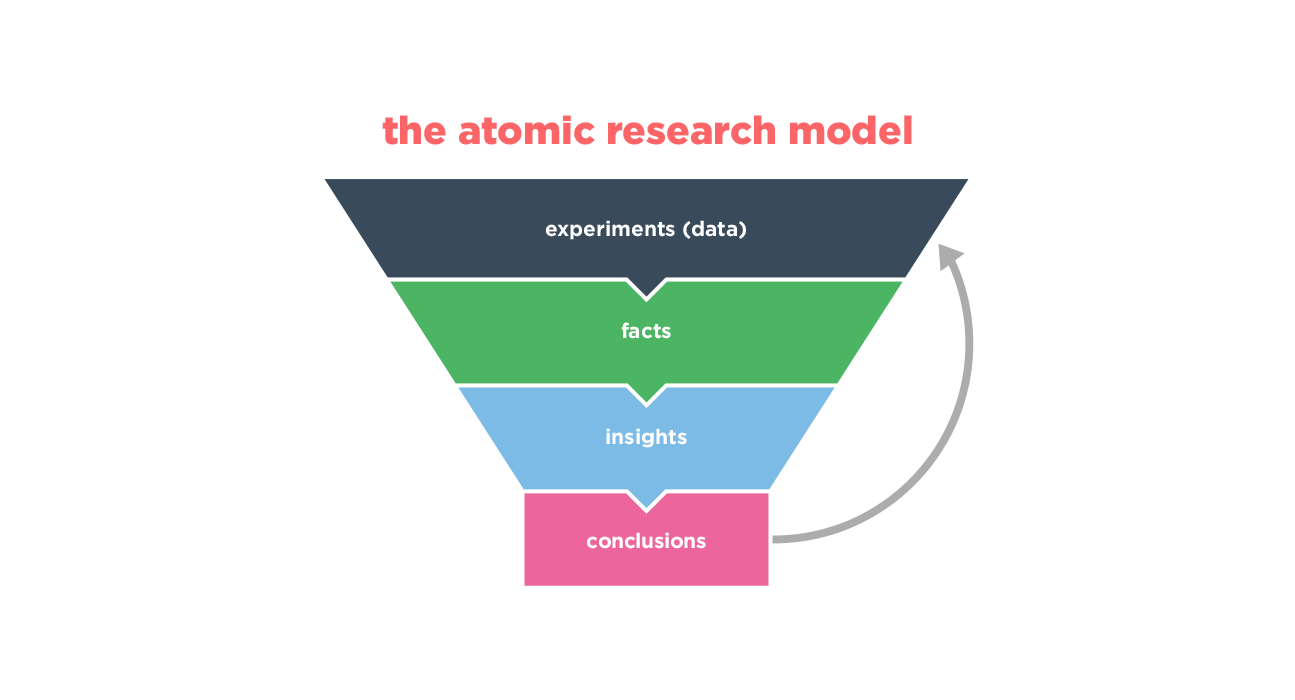
Credit: Daniel Pidcock
What are atomic UX research nuggets?
Atomic research nuggets are the smallest indivisible units of user research data. They’re like the atoms of user experience research, representing a single observation, quote, or behavior captured during research activities such as user interviews, usability tests, or surveys.
Each nugget typically consists of three main components:
- Observation: A concise explanation of what the researcher learned, including the what and the why of user behavior or experience.
- Evidence: Supporting material that backs up the observation, such as video recordings, audio clips, photos, or screenshots.
- Tags: A taxonomy that categorizes the nugget, making it easily searchable and indexable. Tags can include information about research methodology, business structure, demographics, user experience, or where the research insights fit within the user journey.
Unlike UX research reports, which provide a complete overview of a research project, atomic research nuggets focus on specific, granular details. Here’s a quick look at the differences:
Atomic research nuggets | Traditional research reports | |
|---|---|---|
Format | Bite-sized, standalone pieces of information focused on a single insight | In-depth documents covering multiple findings with detailed analysis |
Usage | Can be quickly accessed, combined, and recombined to identify patterns | Used to present findings from specific studies, often read sequentially |
Storage | Stored in searchable repositories or databases with tagging and filtering | Stored as individual documents, harder to search and cross-reference |
Flexibility | Highly modular and adaptable, allowing easy updates | More static, representing a snapshot of findings at a specific point in time |
Context | May lack broader context when viewed individually | Provides full context for research, including UX research methods used and limitations |
Accessibility | Easily shareable across teams, promoting collaboration and democratization | Often in silos, making it challenging to disseminate insights widely |
The evolution of atomic research: A brief history
Atomic research in UX started as a solution to a common problem: research findings needed to be easier to manage and use. Traditional research often created long reports that no one had time to read, leaving important insights unused. To fix this, UX teams began breaking research into smaller, simpler pieces that were easier to organize and share.
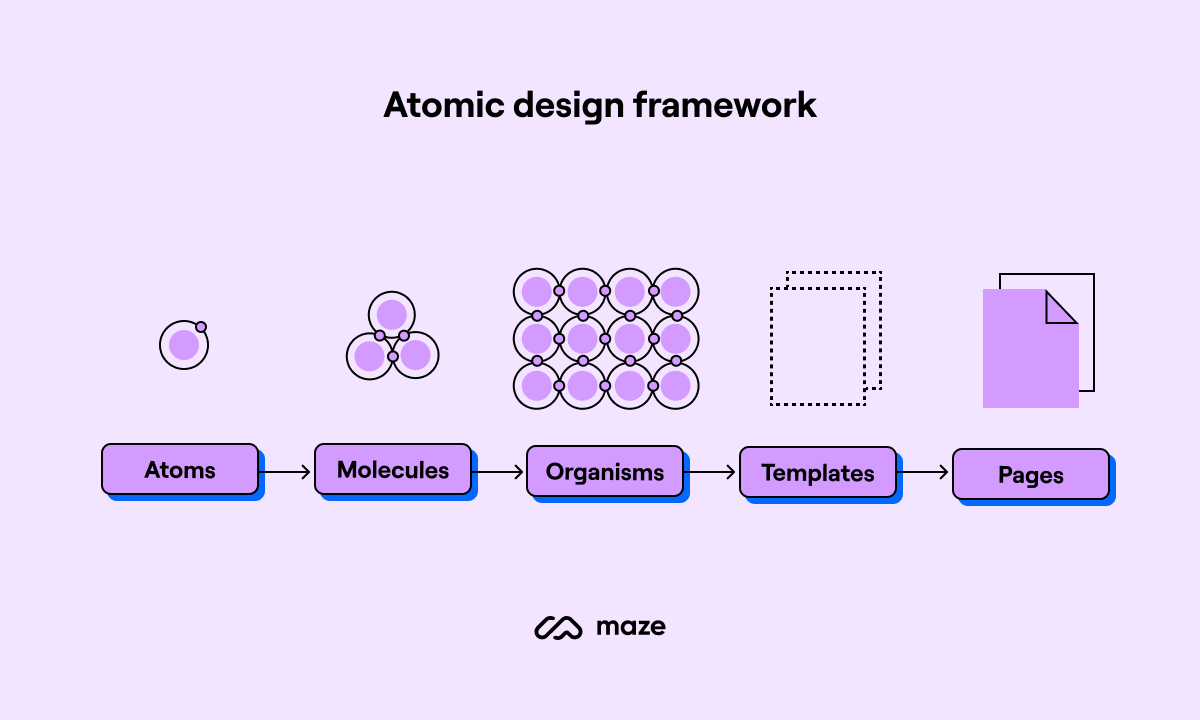
The idea comes from the atomic UX design framework, introduced by Brad Frost in 2013. Atomic design breaks user interfaces into small, reusable parts—like buttons or input fields. Atomic research applies the same idea to insights, breaking them into small, valuable pieces that teams can build up to use again and again.
In 2017, Tomer Sharon at WeWork introduced Polaris, a system for storing research findings. Polaris focused on ‘nuggets’—small, tagged pieces of research that were easy to discover and came from evidence-based thinking. Around the same time, Daniel Pidcock shared a similar idea. He suggested organizing research into experiments, facts, insights, and recommendations.
And thus, the foundations of atomic research were laid.
What are the applications of atomic research in UX?
Atomic research helps you turn insights into real action—here’s how.
- Prioritize what matters in your product roadmap: Insights from atomic research make it easy to spot user pain points and prioritize fixes or new features. For instance, you know exactly where to focus next if multiple nuggets highlight frustration with search functionality.
- Iterate faster on UX designs: When testing prototypes, you can pull relevant insights to guide changes without redoing everything. This evidence-based approach ensures your iterations address real user needs.
- Run smarter usability tests: When you focus on targeted research questions and problem areas, you can run more efficient usability testing. Results feed directly back into your system as actionable nuggets for future use.
- Craft experiences that fit different users: Breaking research into focused pieces allows you to design for specific user personas. For example, onboarding can be customized for first-time users versus returning customers based on distinct insights.
- Align your team and stakeholders: Clear, tagged insights ensure everyone understands user needs, from product designers and PMs to developers. This keeps discussions grounded in evidence rather than opinions, whether you're planning features or presenting to stakeholders.
- Create campaigns that resonate: Insights aren’t just for design and UX knowledge. Marketing teams can use them to craft messages that address user pain points, ensuring a consistent and user-centered approach across departments.
Which organizations can benefit from atomic research?
Atomic research isn’t for every organization, but it becomes invaluable in certain scenarios. Tomer Sharon outlined three types of organizations that stand to gain the most:
- Organizations with many employees: Companies with thousands of employees, especially those distributed across different locations, often need help maintaining a unified understanding of their customers. Atomic research helps create a shared UX research repository of user insights, keeping all teams aligned and informed. This is especially helpful for organizations where consistent communication across teams is critical.
- Organizations with a large customer base: When serving thousands or millions of customers, it’s easy to lose track of individual user needs. Atomic research breaks down customer insights into small, actionable nuggets, ensuring teams can focus on addressing specific pain points. This makes identifying trends, prioritizing issues, and building solutions that resonate with users easier.
- Organizations with multiple customer touchpoints: Companies that interact with users across physical, digital, and human-to-human channels often need help to deliver a seamless experience. Atomic research helps these organizations to organize insights from all touchpoints, providing a more holistic view of the user journey. This makes it easier to create consistent and integrated experiences across platforms.
What are the pros and cons of atomic research?
Like any approach, atomic research comes with its own set of advantages and challenges. To decide if it’s right for your organization, it’s important to weigh the benefits against the potential drawbacks. Let’s break it down.
Pros | Cons |
|---|---|
✅ Insights are accessible to all teams, fostering collaboration and ensuring everyone works from the same data ✅ Organized insights save time during meetings and planning, helping teams make faster, evidence-based decisions ✅ Nuggets can be reused across projects, reducing repetitive research and keeping past findings valuable ✅ Encourages smarter problem-solving by focusing on specific user needs, avoiding guesswork in design and strategy ✅ Empowers teams to focus on solving real problems with actionable insights rather than getting lost in lengthy reports | ❌ Setting up a structured repository takes time and requires dedicated resources to get it right ❌ Poor tagging or inconsistent organization can create bottlenecks, making it harder to find what you need quickly ❌ Breaking insights into small units can feel like busywork without clear goals, leading to inefficiencies ❌ Requires ongoing updates and monitoring to keep the repository relevant, which can strain teams without dedicated ResearchOps support ❌ If poorly implemented, it risks becoming another underused tool instead of a productivity booster |
The atomic research process: How to turn UX research into atomic nuggets
Daniel Pidcock, a leading voice in atomic research, outlines a simple way to turn research into actionable knowledge. This process organizes findings so teams can make decisions faster and learn continuously. Let’s look at the steps in the research model.
1. Run experiments to gather raw data
The first step in atomic research is running experiments to collect reliable raw data. This involves choosing the right research methods, such as usability testing, surveys, or moderated interviews, to observe how users interact with your product. You can learn more about structured research techniques from UX research resources.
Start with a clear objective. Ask yourself: What do we need to learn? Whether you’re trying to understand why users abandon a sign-up form or you’re testing a new feature, defining your research objective keeps the project focused.
Recruiting the right participants is another critical step. Your participants should represent your actual users to ensure the data reflects real-world behavior. Creating effective user personas can help you identify the right audience.
Utilize a user research tool, like Maze, to make the recruitment and UX research process smoother. You can access a Panel of over three million B2B and B2C participants across more than 130 countries. This diverse pool allows you to apply over 400 filters to target specific demographics, ensuring your research reaches the right audience.
Document everything in detail. Record raw data such as task completion rates, user quotes, or session videos. Use a research repository to store and organize your findings. This ensures your data remains accessible and usable as you move through the research process.
Remember, stick to observing what users do and say. This stage is about collecting data, not jumping to conclusions.
2. Extract facts from your findings
Once you’ve gathered raw data, the next step is to pull out the facts. Facts are unbiased, evidence-based observations that describe what happened during your experiments. This stage focuses on documenting what you know for certain without adding interpretations or opinions.
- Review your raw data thoroughly: Review your data carefully to identify facts. This step works best when your UX workflow is streamlined, ensuring data is easy to analyze and reference.
- Stay objective: Facts are neutral and free from assumptions or cognitive biases. For example, if you ran a usability test and saw that three out of five participants struggled to locate the search bar, that observation becomes a fact: “60% of users could not find the search bar.” Avoid statements like “Participants struggled because the design is unclear,” which mixes observation with opinion.
- Be specific and measurable: Generalized findings, like “users had issues,” don’t provide actionable value. Instead, use precise statements such as, “three out of five users clicked the wrong menu option.”
- Tag your findings for easy retrieval: Organize your facts by tagging them with relevant metadata—such as demographics, research methods, or product areas. A collaborative structure leads to consistency and clarity, meaning you can later file away or refind specific facts.
3. Connect facts to generate insights
With facts in hand, the next step is to connect them to uncover insights. Insights are the “aha!” moments that explain what your facts mean and why they matter. They don’t stand alone—they emerge by identifying patterns, linking related facts, and interpreting the bigger picture.
For example, if multiple facts show users clicking the wrong button or abandoning a process, the insight might be: “Users don’t understand the button’s purpose, possibly due to unclear labeling.” Insights like this are evidence-based conclusions that highlight what’s happening and hint at possible solutions.
This step requires careful analysis. Facts from different experiments, such as usability tests and surveys, can complement each other and form stronger insights. The key is to stay grounded in the data and avoid jumping to unsupported conclusions.
4. Create recommendations to solve problems
Once you’ve identified these insights, it’s time to turn them into actionable recommendations. Recommendations answer the question, “What should we do about this?”
Start by linking each recommendation directly to an insight. For example, if your insight reveals that users struggle with unclear button labels, the recommendation might be: “Update button labels to include action-oriented text, like ‘Submit Form’ instead of ‘Submit.’”
Recommendations should be specific and achievable. Instead of vague suggestions like “Improve navigation,” provide concrete actions such as “Reorganize the navigation menu into three clear categories based on user feedback.” This clarity helps teams prioritize and act efficiently.
It’s also helpful to prioritize recommendations. Use evidence, such as the number of users affected or the impact on key metrics, to determine which changes should come first. Clear prioritization ensures the most critical issues are addressed without overwhelming your team.
5. Test your recommendations and refine
Testing your recommendations is where ideas meet reality. This step ensures that your solutions address the user problems identified during the research process.
Start by defining success. Identify measurable outcomes that will tell you if your recommendation worked. For example, if you recommended changing a button label to make it clearer, measure whether more users complete the action or spend less time deciding what to click.
Testing methods vary depending on the recommendation. Usability tests can reveal immediate feedback on design changes, while A/B testing works well when comparing two versions of a feature. Live experiments, such as deploying updates to a subset of users, can provide real-world data to validate your changes.
Sometimes, tests won’t go as planned—and that’s okay. If your recommendation doesn’t achieve the desired result, revisit and refine your insights.
Now that you’ve refined your recommendations, the next step is to ensure your research lives on as a valuable resource for your team.
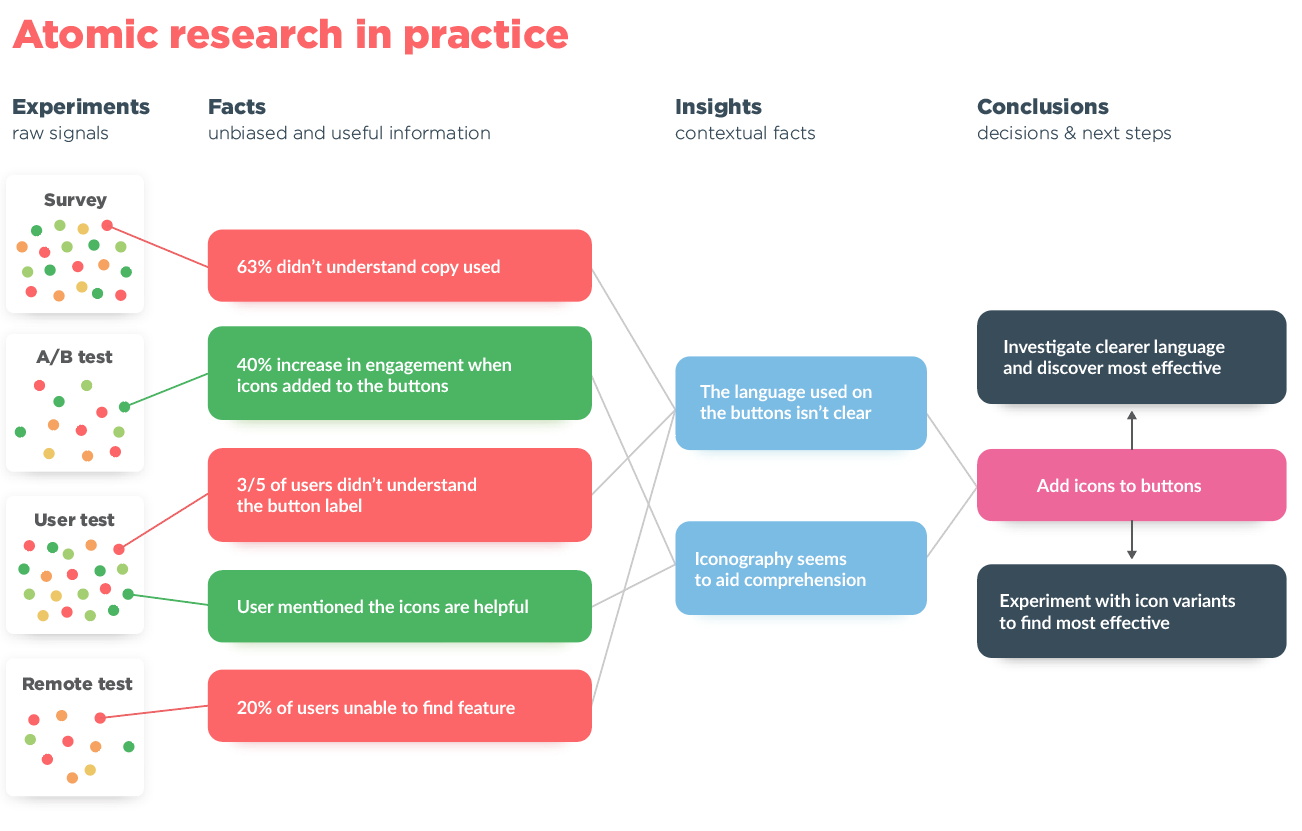
An example of atomic research in practice, by Daniel Pidcock
How to store and share atomic research
If your findings aren’t stored and shared properly, they might as well be locked in a dusty filing cabinet labeled ‘Lost Forever.’ Let’s make sure that doesn’t happen.
- Centralize your repository: All experiments, facts, insights, and recommendations should live in one organized system. A centralized repository ensures that your team can quickly locate relevant findings, reducing time spent searching and avoiding duplication of work.
- Document findings consistently: Use standardized templates to record data at every step. Consistency helps teams understand and build on previous work without needing extra clarification. Clear documentation also ensures that new team members can quickly grasp past research.
- Apply descriptive tags: Tag your findings with relevant metadata, such as project name, user demographics, or research method. This makes filtering and connecting related findings easier, allowing teams to reuse insights across projects.
- Encourage active use: Storing research isn’t enough; it must be shared regularly. Make your repository a go-to resource during meetings, strategy sessions, and design reviews. Teams that actively use and update the repository are better equipped to make informed decisions.
- Protect sensitive data: Implement access controls to ensure sensitive information is only accessible to those who need it. Regularly review your data-sharing policies to comply with privacy regulations and maintain trust.
Uncover atomic research nuggets with Maze
Maze is paving the way in redefining how user research impacts decisions across organizations. With its vision for Atomic Evidence, Maze is focused on turning granular data points into powerful research narratives.
Here’s how you can use Maze to turn your data into actionable evidence:
1. Create user tests with ease
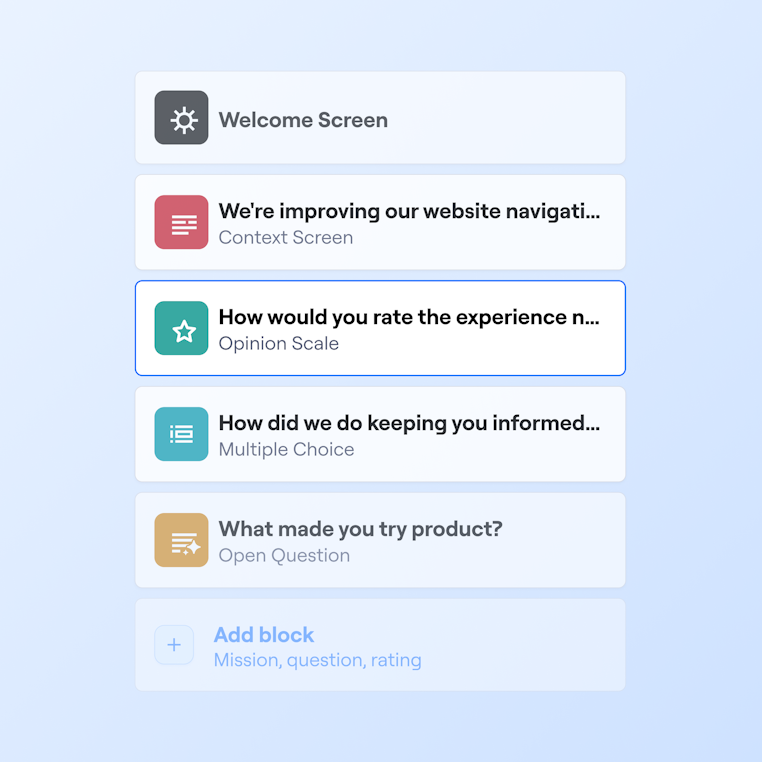
Whether you’re running usability tests, user interviews, A/B tests, or gathering feedback on prototypes created in design tools like Figma, Maze offers a comprehensive set of UX research methods. With pre-made templates, an intuitive drag-and-drop interface, screen recording, and AI-powered follow-up questions, your research study can quickly capture the data you need.
2. Recruit participants instantly with Maze Panel
With Maze Panel, you can access a pool of over three million testers worldwide—filter participants by age, location, profession, or other demographics to match your target audience. Already have your own testers in mind? Maze Reach allows you to invite your participants directly, offering the flexibility to use internal teams, loyal customers, or niche groups for more tailored feedback.

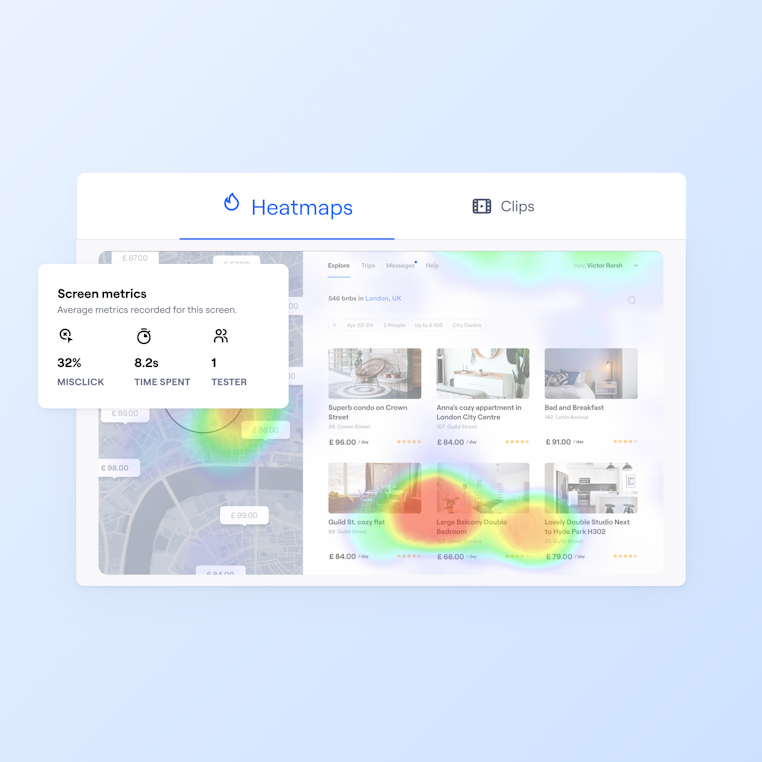
3. Analyze results with automated reports
4. Organize qualitative data into themes
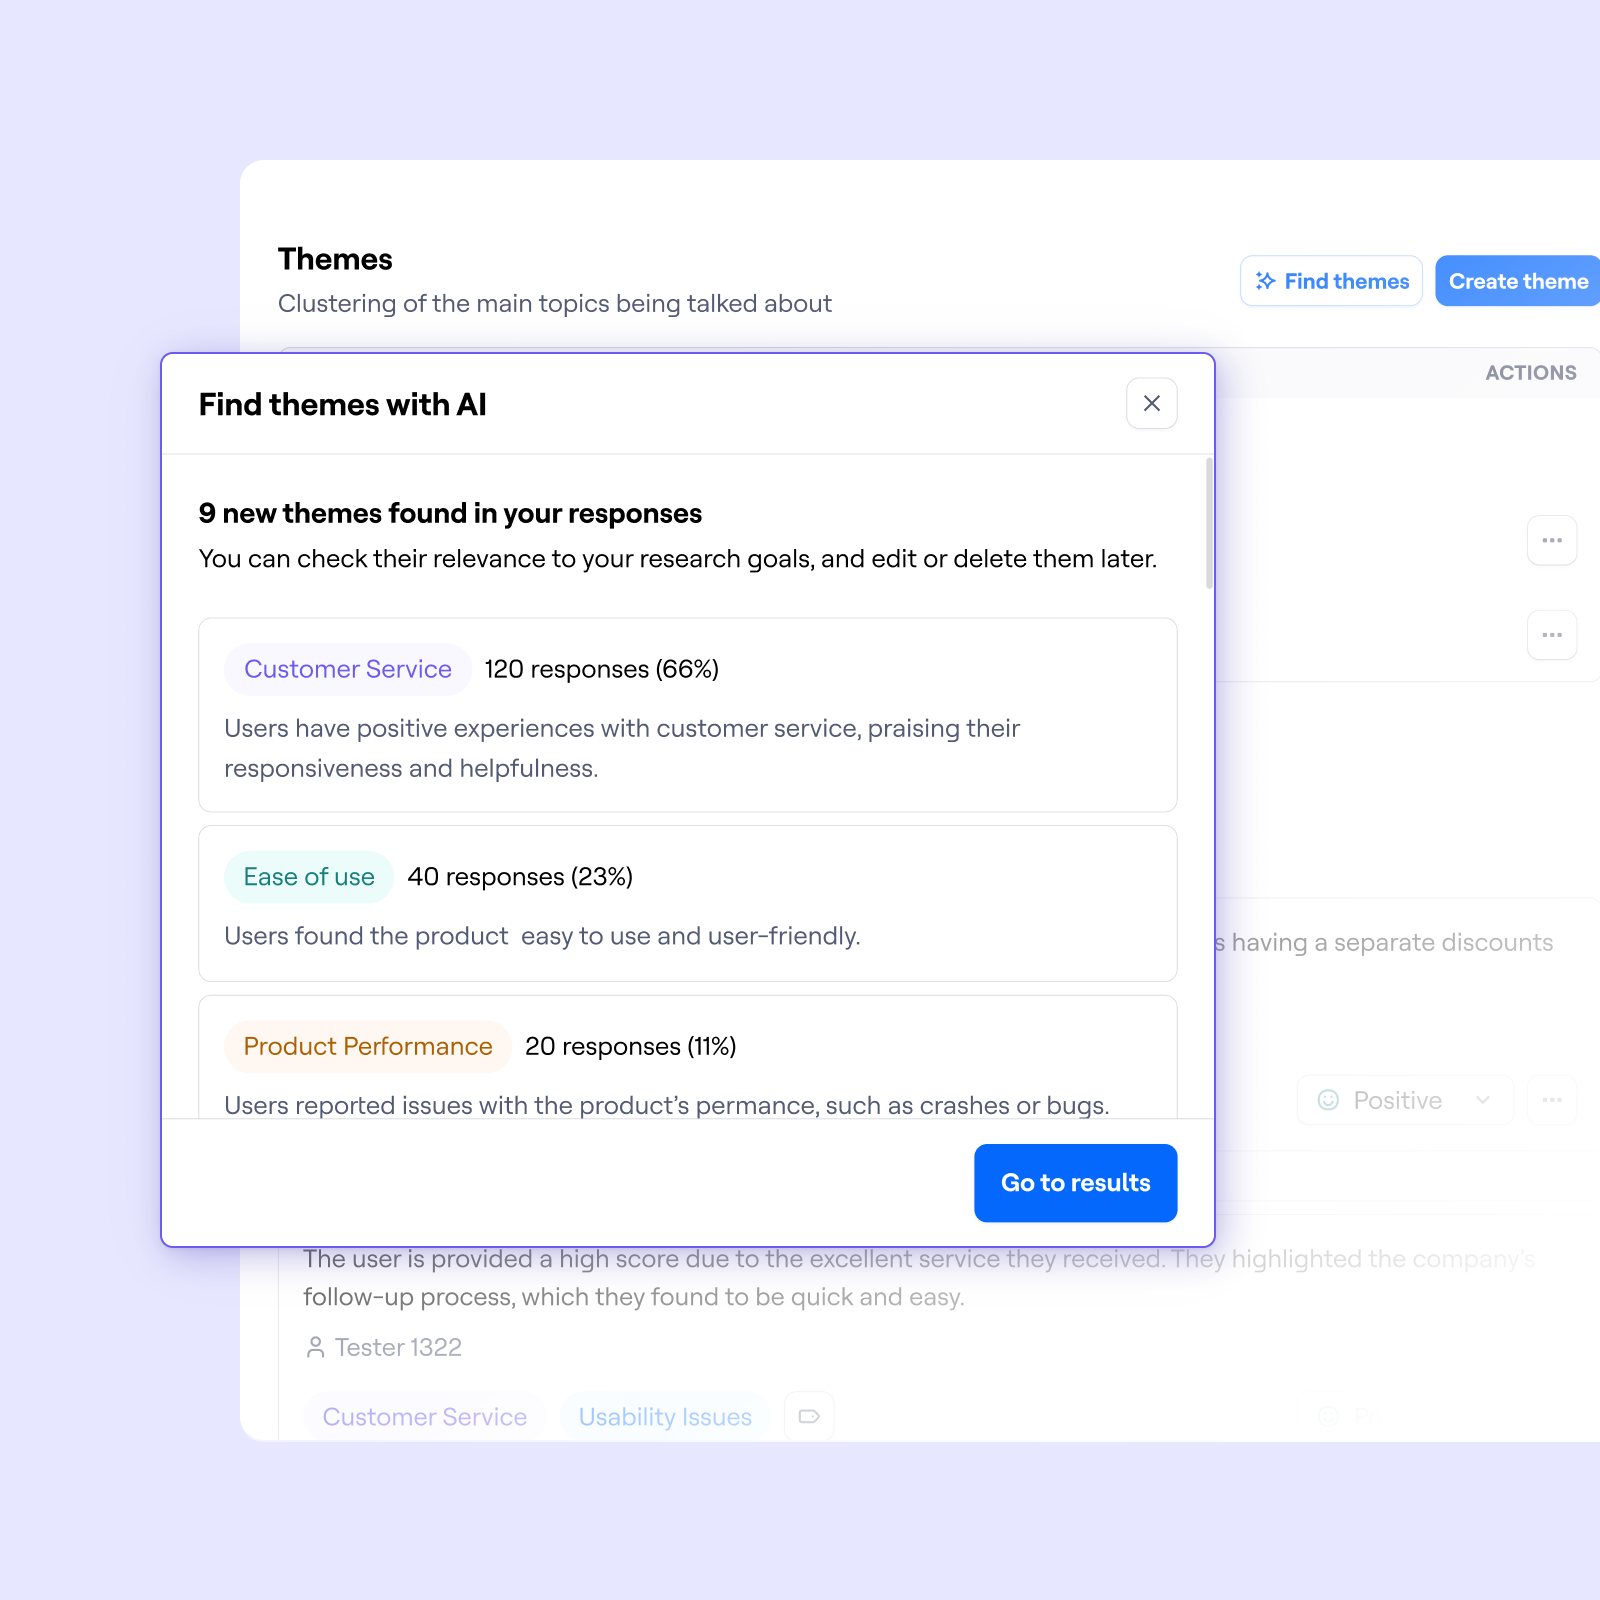
Use Maze’s AI-powered themes feature to group open-ended responses into meaningful categories. For instance, if testers frequently mention “confusing button labels,” the tool highlights this as a recurring theme. This feature saves hours of manual sorting and helps you focus on acting on your experiments.
5. Share insights with stakeholders instantly
Once your findings are ready, share them using Maze’s presentation mode or export them as PDF reports. Include usability scores, screenshots, and key recommendations in a format that is easy for teams and stakeholders to understand. You can back decisions with clear, visualized data in your next product meeting.
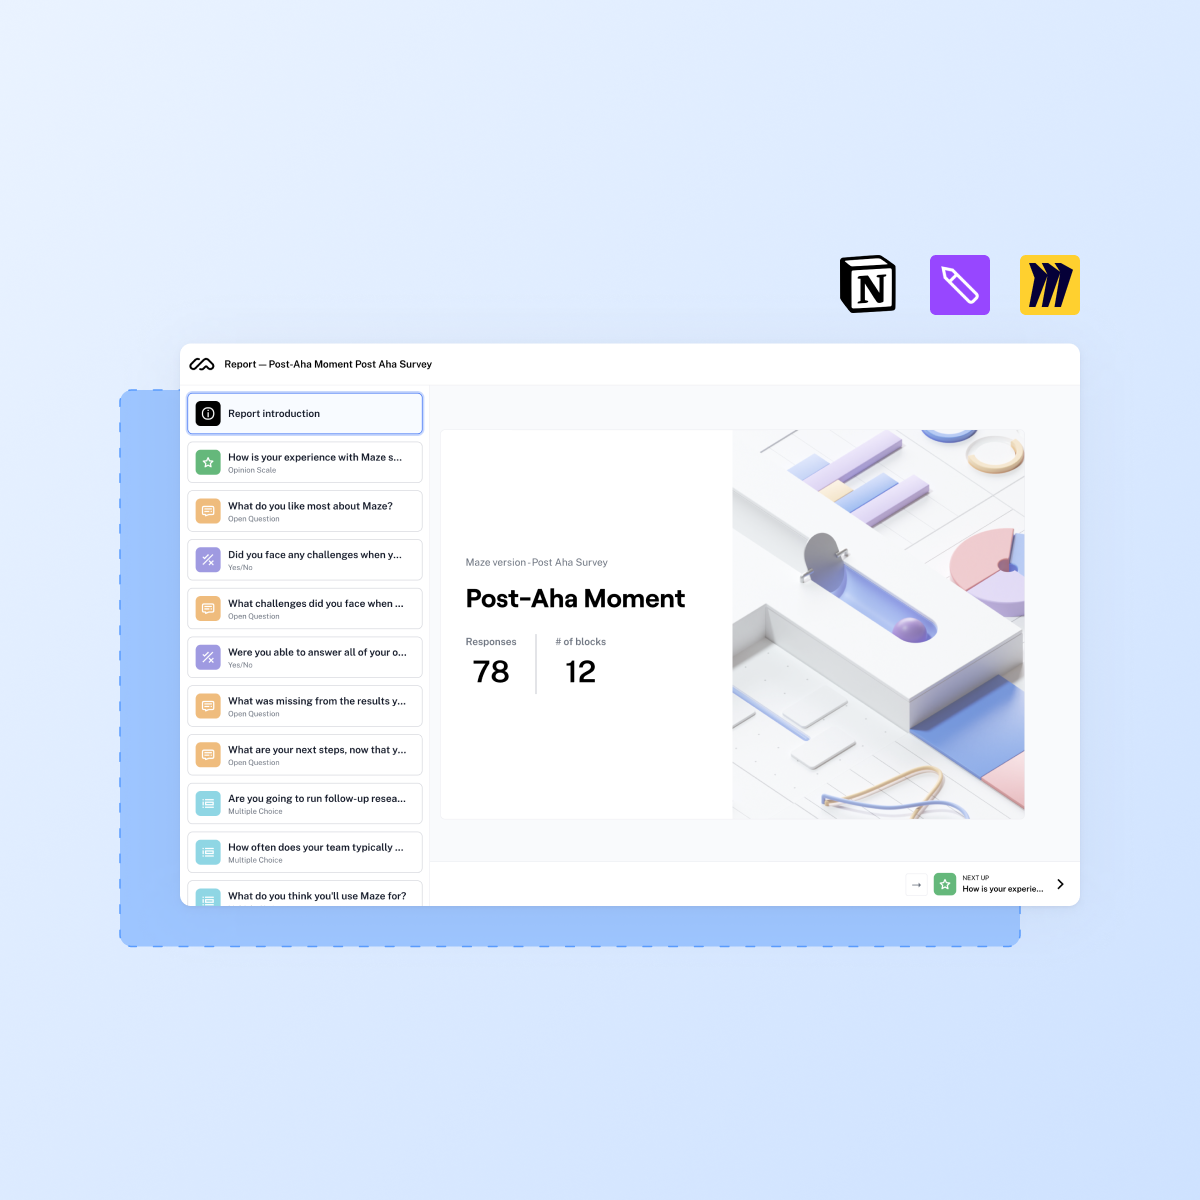
Maze doesn’t just improve research methods—it rethinks how teams capture, analyze, and act on user insights. This ensures user research becomes a critical driver of business and product strategies.
Although Atomic Evidence is still in early development, Maze’s powerful suite of user research tools can already help you capture atomic nuggets. Use these nuggets to inform your decision-making, and watch this space for updates on building dynamic, interconnected artifacts within and outside Maze.
Frequently asked questions about atomic research
What is the atomic study method?
What is the atomic study method?
The atomic study method, developed by Daniel Pidcock and Tomer Sharon, breaks research into small, actionable units called ‘nuggets.’ Each nugget is tagged, backed by evidence, and stored for easy access. This method helps teams uncover patterns, generate insights, and make data-driven decisions. It transforms research into a reusable, dynamic resource that stays relevant across projects.
What are the benefits of atomic research?
What are the benefits of atomic research?
Atomic research improves how teams manage and apply research findings in several ways:
- It saves time by eliminating repetitive research through accessible insights
- It delivers actionable insights backed by evidence, ensuring data drives decisions
- It organizes knowledge by breaking findings into small, tagged units, making them easy to store and reuse
- It boosts collaboration by creating a centralized system where teams can share findings effortlessly
- It integrates research into workflows, enabling teams to make smarter, data-driven decisions every day

