


TL;DR
Usability metrics quantify how real users interact with your product by measuring how easily they complete tasks, where they get stuck, how long they take, and how satisfied they are. Tracking metrics like completion rate, time on task, misclicks, and satisfaction scores helps teams identify friction points, prioritize improvements, and align on data-driven decisions. When integrated into the design process, these metrics support continuous iteration and track progress over time.
Have you ever launched a new product or feature, only to discover everything you expected users to do... they didn’t? Your team put in countless hours, but it didn’t pay off the way you thought it would—in fact, your user base is shrinking. Whether it’s the UI design, platform functionality, or navigation, something is causing a disconnect.
Enter: usability metrics.


What are usability metrics?
Usability metrics are the specific measurements and type of statistics used to review the usability of your product. They can track how quickly users complete certain tasks, how frequently they make mistakes, their overall satisfaction using the platform, and more. By reviewing different types of usability metrics, you can paint a picture of the user’s experience and understand the overall usability of your product.
Different usability testing methods provide different metrics. Determining which metrics to track is an important step when creating your usability testing plan, as you’ll be able to tailor tests to provide relevant insights.
Types of usability metrics
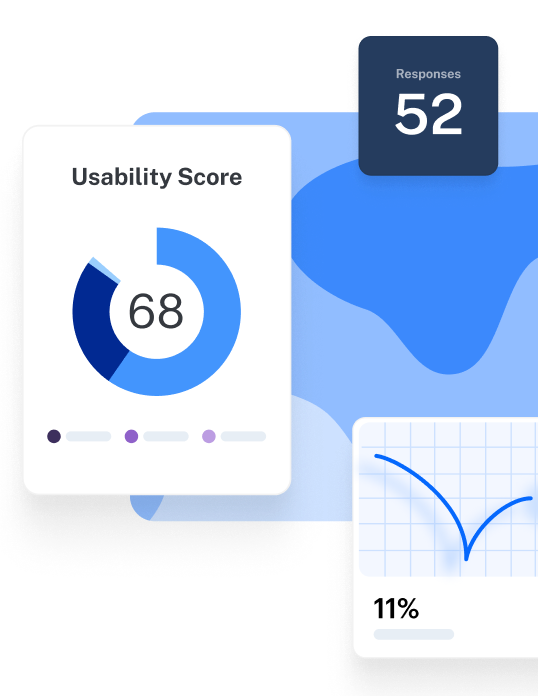
Usability testing metrics are usually divided into four categories—each providing insights into different areas of your product's usability. With a robust usability testing platform, you can automatically generate reports to digest and organize your metrics. This gives an at-a-glance view of how your product is performing for any key stakeholders—and helps prepare for future sprints.
To maximize your takeaways, include a mix of these four types of UX metrics:
- Completion or success metrics: Measure whether users can complete tasks effectively. When attempting a task, the design can fail, succeed, or indirectly succeed.
- Duration metrics: Track the average time users spend on a particular screen, or review how long it takes users to perform a task. Time is a vital indicator of your design’s complexity—these metrics show how efficiently users navigate and operate your product.
- Error metrics: Unlike a technical error or bug, this refers to actions users perform on your website or app that don’t lead them to the expected solution—e.g. a user wants to log in but clicks on the ‘sign up’ button instead. Error metrics highlight areas of confusion in the user interface (UI) or convey challenges with functionality.
- Satisfaction metrics: Gauge how satisfied your users are with their overall experience using your product. Metrics like system usability survey (SUS) or net promoter score (NPS) evaluate the overall sentiment after interacting with your product.
Remember 💡
When discussing metrics, particularly completion or success, you're measuring the effectiveness of the design, not the user. Bear this in mind as you write your plan, instructions, and report.
Why is measuring usability metrics important?
“The biggest benefit to conducting usability testing is that you get to build scalable products with a short learning curve, which then translates into satisfied users,” says Belén Ardiles, Product Designer at StockFink. This benefit can be more easily tapped into if you’re tracking usability metrics, as these will be the backbone of your decision-making process.
Remember: surveys and interviews can give you valuable quantitative insights, but they won’t provide broad statistics or necessarily show you a numerical translation of how your users interact with and experience your product’s UI.
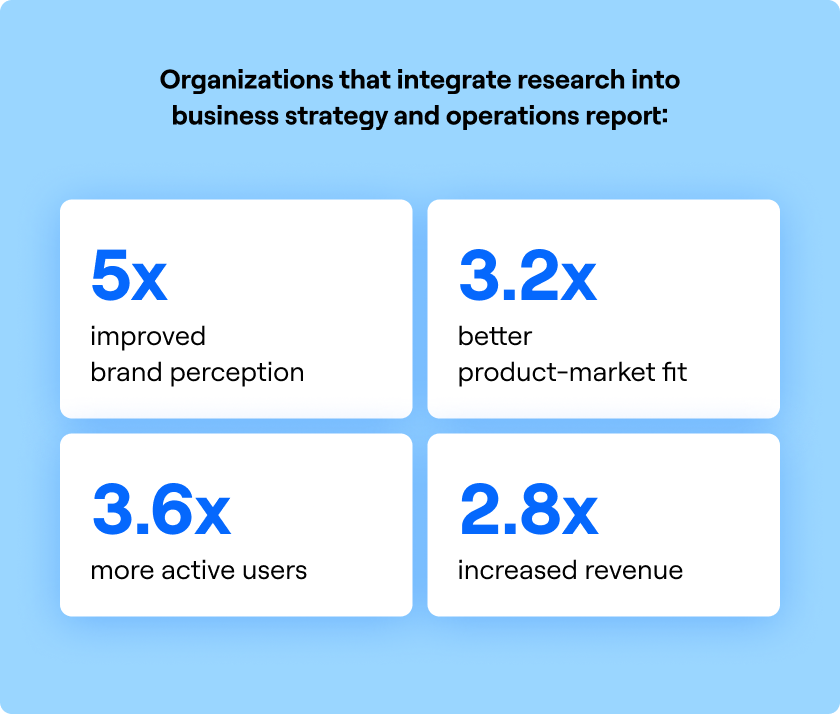
In our 2025 Future of User Research Report, we found that organizations who integrate research into business strategy see 3.6x more active users, 3.2x better product–market fit, and 2.7x stronger outcomes overall compared to teams that collect insights but rarely act on them.

Usability metrics help you:
- Cut through bias: They counteract effects like the Aesthetic-Usability Effect—a cognitive bias where users perceive pretty designs as more usable. Metrics help ensure you're measuring real performance.
- Spot and fix user-facing issues early: Struggling to meet an OKR, such as increasing conversions? If 67% of users abandon your signup flow after 15+ seconds of friction, that’s a data-backed call to action.
- Prioritize improvements: Metrics help sort the ‘nice-to-fix’ from the ‘must-fix.’ When 72% of users rely on search to find basic features, you know where to focus.
- Build alignment: When internal opinions clash, usability testing creates clarity. As Belén Ardiles, Product Designer at StockFink, shares, “I discovered that if we had developed the prototype as we designed it, we’d have failed to make the app truly intuitive to the end user. Test participants experienced difficulties around handling alerts and taking proactive steps to get educated and mitigate future risk.”
- Track progress over time: When you run tests across iterations, you can benchmark performance, track improvements, and show momentum with every release.
We shouldn’t be afraid to talk directly to users and get them to point out design opportunities. Usability testing should be a mandatory step in design so we can come up with interfaces that communicate and reflect the vision and value the platform is expected to give.
Belén Ardiles
Product Designer at StockFink
Share
In short, usability metrics are how you prove what’s working, what’s not, and why it matters. In a world where 87% of companies now rely on research to inform critical decisions, metrics help ensure your voice and your users’ voices drive the product forward.
12 Key usability metrics and how to calculate them
When you start determining which usability metrics to track, revisit your project objectives and consider which metrics will best inform those goals. There are a ton of different ways to track the results of usability studies, but these are the key metrics you can’t afford to skip:
The formulas used below have been sourced from various platforms to find the most widely-used formulations for calculating usability metrics. Remember to measure results against your platform's specific goals and benchmarks so you're optimizing for the metrics that matter most to your product and users.
1. Completion rate
Type: Success metric
The completion rate—also known as a task success rate—allows you to assess the percentage of users who can navigate your product intuitively. Task completion is usually presented as a binary value of ‘1’ if users completed the task and ‘0’ if they didn’t. It’s one of the most direct indicators of learnability, especially during user testing or product trials.
“The usability metric that helped me the most was completion rate—it allowed me to validate whether or not the software’s main objective was met, and if users were finding it easy to follow the predetermined path. I used the user data to modify the app which added value and gave us an advantage against competitors,” says Belén.
How to measure the completion rate
To calculate the task completion rate, you should divide the number of completed tasks by the total number of given tasks and multiply it by 100.
Completion rate = (Number of completed tasks / total number of assigned tasks) x 100
You can calculate the completion rate per user or by study. For example, if a participant gets a 10/10 task success, that user would have a 100% completion rate. But, if 8/10 users complete 3/10 tasks, and the other two have a perfect score, your usability study completion rate would be 44%.
Number of tasks completed = (8 x 3) + (2 x 10) = 44
Total number of assigned tasks = 10 x 10 = 100
Completion rate = (44 / 100) x 100 = 44%
Product tip ✨
If you’re using Maze, this metric is automatically calculated—you’ll see it presented in your usability study downloadable report.
2. Direct or indirect success
Type: Success metric
These metrics are an extension of the completion rate and tell you whether the user completed the task as you expected. For example, if you think someone will click on the signup button from the homepage and that’s exactly what they do, it’s a direct success. But, if they go to the login page first and click on the signup button from there, that’s an indirect success.
It’s a good measure of usability if the majority of your users can complete their tasks using the flow you designed. With a usability testing platform like Maze, you can set the expected paths you think users will take as they navigate your platform. If it coincides with the one users take, the result is a direct success.
How to measure direct or indirect success
To measure this metric, you’ll need to analyze the expected path and the actions your user took. If you find a match, there was a direct success; if you don’t, it’s an indirect one. You can calculate the percentage of direct or indirect success with the following formulas:
Direct success rate = (Number of completed tasks with direct success / total number of completed tasks) x 100
Indirect success rate = (Number of completed tasks with indirect success / total number of completed tasks) x 100
3. Fail rate
Type: Success metric
This metric is also a way to categorize your completion rate. Unlike direct or indirect success, a user fails when they can’t solve a task and simply abandon it. Tracking this helps flag high-friction areas and usability problems that impact user satisfaction or drop-off in e-commerce journeys.
It's important to ensure tasks are achievable in the first place before tracking ‘fail’ usability metrics. For example, if a task is designed to be completed in five minutes but across all users it takes an average of 10 minutes to complete, this wouldn’t necessarily be a ‘fail’ usability metric, because they did complete the task, but outside the time parameters—and the average result says perhaps the original timeframe was unrealistic.
However, if a task requires users to enter information that is impossible to provide, this would be considered a ‘fail’ in your usability metrics. You’ll recognize this one if you’ve ever been asked to fill in a digital form with a required field that doesn't permit the correct input, e.g. being asked to provide a phone number in a text-only box.
How to measure fail rate
You can measure this by using usability testing tools that record users’ clicks during the usability test. Or, to calculate a fail rate, follow this formula:
Fail rate = (Number of failed tasks / total number of assigned tasks) x 100
4. Time on screen
Type: Duration metric
Time on screen measures how long a user spends on a particular screen. Users spending a long time on a screen is an indicator that they can't find what they’re looking for (except for blog posts or pages with readable content, where the user might naturally spend more time). If you review the time on screen along with metrics like misclick rate, you can spot issues with the interface, labels, or layout of the page.
How to measure time on screen
Time on screen is usually calculated by your testing platform. It records the amount of time your user spends on the same screen before moving to a different one. However, if you’re doing this in person, you can calculate it using a stopwatch or clock. Pair it with error data or quantitative data, such as misclicks, to better understand user behavior.
5. Time on task
Type: Duration metric
Time on task measures the duration users take to complete a task; users taking too long to complete a task might indicate they can't find what they're looking for or are lost trying to complete the task.
Time on task isn’t a metric that you should review on its own. You need to contextualize the number and try to understand why it’s taking so long for users to complete a task. You want to know if users are taking longer than expected on a task because of the design, copy, instructions, or information architecture.
How to measure time on task
Similar to time on screen, your testing platform should calculate this as your users go through your test. It can be particularly useful to review screen recordings at the same time, to pinpoint where users are struggling. If you’re doing this in person, you can use a timer to manually measure the time your users spend on each task and have a moderator track where difficulties arise.
Product tip ✨
Maze can record usability metrics automatically for you during unmoderated usability evaluations. Try these templates for usability testing and create test projects within minutes.
6. Misclick rate
Type: Error metric
The misclick rate is the average number of misclicks outside the hotspots or clickable areas of your product. This usually happens when your user finds your platform unintuitive or is expecting it to act similarly to other websites.
According to Jakob's Law, “users spend most of their time on other websites”, so they expect yours to function like the ones they already know. If it doesn’t, this can cause usability issues. Review the misclick rate along with a detailed click heatmap to see exactly where your users are clicking, and adjust your design accordingly to clarify.
How to measure misclick rate
To calculate your product’s misclick rate, you need to divide the number of misclicks by the total number of clicks and multiply it by 100.
Misclick rate = (Number of user misclicks / total number of user clicks) x 100
For example, if a user made 15 clicks during the test and three were misclicks, your misclick rate will be 20%.
High misclick rates usually point to poor hierarchy or unclear hotspots. Especially during user testing, this can reveal mismatches between expectations and interface logic, hurting both user satisfaction and conversion rate.
7. Number of errors
Type: Error metric
This is a pretty self-explanatory metric: it calculates the number of errors your participants make while attempting to complete a task. This can include errors made while performing a task i.e. accidental actions, slips, or oversights. The higher the error rate, the harder users find your product to use.
For example, let’s say your users can’t register because the platform has strict password requirements—if these prerequisites aren’t disclosed to the user, they’ll end up trying different combinations until they succeed or give up. A high error rate here might indicate you need to disclose how many letters, numbers, and special characters the password should contain.
How to measure the number of errors
To measure this, you need to keep count of the times your users make a mistake while completing a task. Depending on the testing tool you’re using, you might get a detailed description of each error so you can classify them. Or, you might get this rate included in an overall usability score.
8. Help requests
Type: Satisfaction metric
Help requests track how often users need assistance during a task. This could be clicking a help icon, using live chat, searching documentation, or asking a moderator. A high number of help requests usually indicates usability issues or unclear UI elements.
How to measure help requests
If you're running moderated tests, note each time users ask for clarification or support. For unmoderated tests or live products, track how often users trigger help tools (e.g. tooltips, chatbots, or FAQ links).
Help request rate = (Number of help requests / Total number of sessions or tasks) × 100
You can also categorize help types (e.g. onboarding confusion vs. error resolution) for more granular insights.
9. Single Ease Question (SEQ)
Type: Satisfaction metric
The Single Ease Question (SEQ) is a quick way to measure how easy users find a specific task. After a user completes a task, they’re asked a straightforward question:
“Overall, how easy was this task to complete?”
Users then share their answers via a 7-point scale, from 1 (very difficult) to 7 (very easy). This gives you clear, comparable, and quantifiable data on task-level satisfaction without adding survey fatigue. Unlike open-ended questions, the SEQ is easy to analyze across users and sessions, making it especially helpful in usability testing.
How to measure SEQ
To collect SEQ responses:
- Ask the question right after each task—while the experience is still fresh
- Use a 7-point scale for consistency with industry benchmarks
- Keep the question wording consistent across studies to ensure reliable comparisons
Once you’ve collected responses, calculate:
- Average SEQ score per task
- Score distributions to see how many users rated a task easy (6–7) vs. difficult (1–3)
- Changes over time as your design evolves
10. Test level satisfaction
Type: Satisfaction metric
To assess test level satisfaction, you should use a longer questionnaire (10+ questions) and share it with users as soon as they finish the test session. This metric allows you to understand how a user feels directly after interacting with your platform.
How to measure test level satisfaction
To calculate test level satisfaction, use one of these surveys:
- System usability scale (SUS): Ask your users to answer 10 questions at the end of the session and gauge their input on: whether they’d use it again, if they had the right support, and if they found it easy to use. If you’re using Maze, you can speed through setup with this system usability scale template.
- Standardized user experience percentile rank questionnaire (SUPR-Q): Measure the overall user experience after the test by asking 13 questions on usability, trust, appearance, and loyalty.
- Computer system usability questionnaire (CSUQ): Ask 19 questions to your users for them to answer using a scale of one to seven, to get an overall satisfaction score.
11. Subjective Mental Effort Questionnaire (SMEQ)
Type: Satisfaction metric
SMEQ helps you understand the cognitive load a task places on users. It goes beyond clicks and timings to capture how mentally taxing a task feels—useful for complex workflows, decision-making steps, or confusing UI flows.
How to measure SMEQ
After each task, ask users: “How mentally difficult was this task to complete?”
Use a numerical scale (e.g. 0–150 or a 1–7 Likert scale). The higher the number, the more difficult the task felt. You can then compare average SMEQ scores across tasks to identify cognitive friction points in the experience.

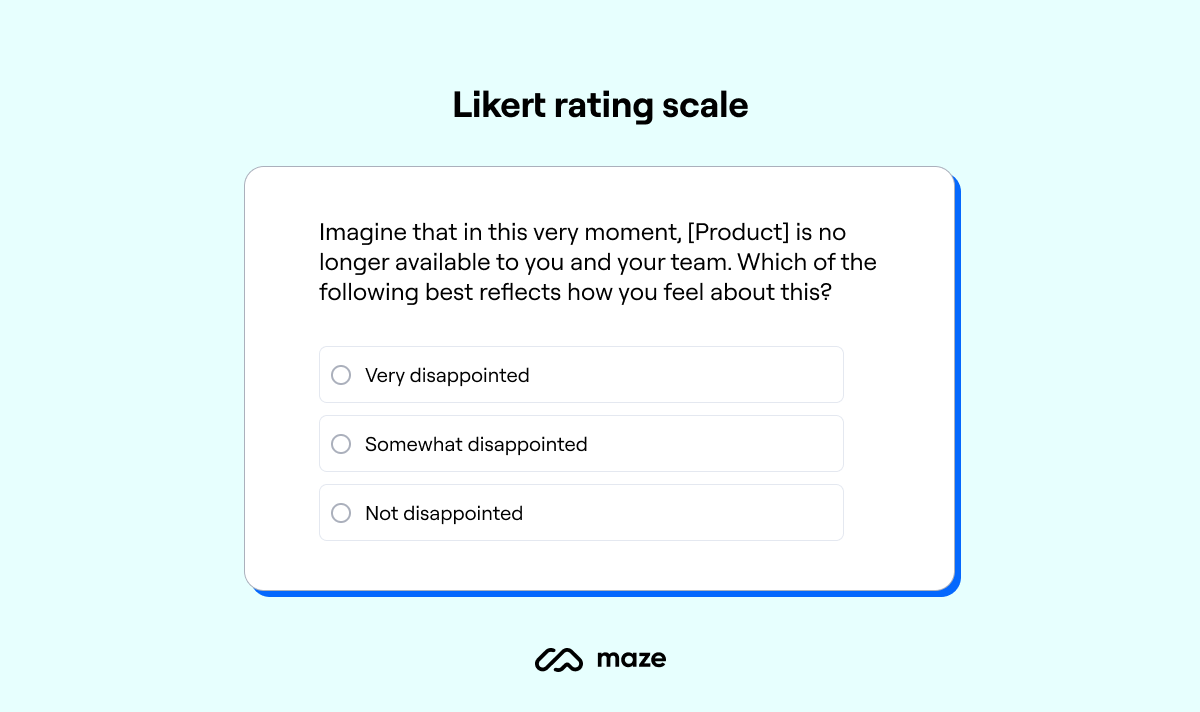
Likert rating scale question from Maze
12. System Usability Score (SUS)
Type: Composite metric
The System Usability Scale (SUS) is a widely adopted survey for measuring a product’s overall usability. It gives you a quick, standardized way to assess how users perceive your system—not just how it looks or functions, but how usable it feels.
SUS asks users to respond to 10 statements, each rated on a 5-point scale from Strongly Disagree (1) to Strongly Agree (5). The questions alternate between positive and negative framing to reduce response bias and cover core themes like ease of use, complexity, confidence, and consistency.
It’s important not to confuse SUS with SMEQ. While both are subjective metrics, they measure different things.
SUS looks at overall usability across an entire system, whereas SMEQ focuses on the mental effort required to complete a single task. Where SUS asks, “Was this product easy to use?”, SMEQ asks, “How hard was this task on your brain?” Use SUS for system-level benchmarking, and SMEQ when you're analyzing friction in specific workflows.
How to measure SUS
To calculate a SUS score:
- Ask users to complete the 10-question SUS survey after their session
- Score the responses:
- For odd-numbered items (positive statements), subtract 1 from the user’s score
- For even-numbered items (negative statements), subtract the score from 5
- Add the adjusted values and multiply the total by 2.5 to get a score out of 100. SUS Score = (Sum of adjusted scores) × 2.5
While the final result appears to be a percentage, SUS is not a percent-satisfied score. It’s a relative index; anything above 70 is generally considered good, and scores above 85 are excellent.
Which usability metrics to track when?
Depending on the usability testing methods you choose to conduct, you’ll measure a different set of metrics—but every type will offer some insight into your users and their experience with your product.
Here’s a quick recap of the usability metrics you should track, depending on the insights you want to get:
If you want to calculate those metrics automatically, opt for a continuous product discovery tool like Maze: you can get all your usability testing results automatically turned into a ready-to-share report, which allows you to instantly act on the data.
How measuring usability metrics improves product development: 3 Examples
Here’s a look at how measuring usability metrics helps teams validate designs earlier, iterate with confidence, and deliver products that are easy to use.
1. Scaling usability testing: 500 tests a year and 75% faster insights at Itaú Unibanco
Itaú Unibanco, one of the largest financial institutions in Latin America, needed a faster, scalable way to validate usability across hundreds of digital products. Their original method, moderated interviews using the Single Usability Metric (SUM), produced valuable insights but couldn’t keep pace with the bank’s product development cycle.
The team integrated Maze into their workflow, and the platform’s automated task-based usability testing replaced interviews with unmoderated studies, and built a simple internal process (the SUM factory) to calculate key metrics like success rate, time on task, and satisfaction scores.
The results:
- 500+ usability tests run annually
- Time-to-insight reduced by 75%
- Sample sizes increased 10x
- 300+ team members using Maze
2. Validating a job search redesign: How NOWJOBS used usability metrics to guide development
To address declining application rates, NOWJOBS redesigned the job browsing experience in their app. They used Maze to run high-fidelity usability tests, measuring task success rates for key actions like applying, deleting, and following jobs.
Each task had pre-set benchmarks: 90% success meant the design was ready, 70–89% triggered small UI tweaks, and anything below 70% required a full rework. This metrics-driven approach gave the team clear validation for their new UI and confidence to move forward with development.
The results:
- Success rates ranged from 73% to 100%
- High-confidence validation of new job vacancy UI
- Iteration focused only where metrics showed need
3. Measuring usability to guide design: How Halftone Digital improved scores by 25%
Halftone Digital, a product design agency, utilized Maze to integrate usability testing into their delivery process, ensuring designs were refined and validated before development. For each project, they generated Maze Reports with a usability score, using it to track progress and communicate results to clients.
One project saw the score rise from 72 to 90, confirming design improvements and boosting client confidence. These measurable outcomes helped the team make quick UI decisions (like choosing between icon styles) and deliver high-quality products more efficiently.
We couldn't do testing in person, and it made sense to go forward with Maze because it was the best way for us to quickly receive feedback and test our designs to ultimately get the app or product out the door.
Mike Arney
Co-founder of Halftone Digital
Share
The results:
- Up to 25% improvement in usability scores
- From 72 to 90 on Maze's usability score scale
- Better design decisions and client communication
- Faster validation before handoff to developers
Usability metrics matter
It's easy to forget to plan for usability metrics—after all, you'll gather data either way, right?
But if you want to maximize your insights, it's well worth taking the time to consider what types of metrics will best inform your product and answer your research questions.
Once you've pinpointed this, you can design your usability test around these metrics and start gathering data that offers a well-rounded, contextualized understanding of your product's usability.
Frequently asked questions about usability metrics
How can I measure website usability?
How can I measure website usability?
To measure website usability you need to conduct usability studies, here’s how to do it:
- Define your testing objectives
- Determine the usability research methods
- Choose a testing tool
- Recruit participants
- Create test scenarios
- Build tests
- Conduct the study
- Review the results
- Implement changes
- Continue testing your live website for usability
What are the different types of usability metrics?
What are the different types of usability metrics?
There are four different types of usability metrics:
- Completion or success metrics: Measure if users succeed or fail when completing test tasks
- Duration metrics: Track the time users take to finish tasks
- Errors: Measure the actions users take on tests that lead them to an undesired solution
- Satisfaction metrics: Determine how satisfied your users are with your product and its UX
How can I improve user engagement on my website?
How can I improve user engagement on my website?
You can improve user engagement on your website by:
- Testing your site for usability and identifying bottlenecks
- Making your screens more intuitive
- Improving your page loading time
- Writing engaging and clear copy
- Creating long-form content and inviting users to interact in comments
How can I improve user flow on my website?
How can I improve user flow on my website?
You can improve user flow on your website by getting to know your users and mapping the customer’s journey. By identifying their pain points and each touchpoint they have with your product, you’ll be able to provide better and more intuitive solutions that they’ll use and recommend. Study your expected paths, content hierarchy, and copy.