


Chapter 14
How to analyze and report usability test results
TL;DR
Usability test analysis involves organizing raw data, digging for valuable insights, and prioritizing issues by severity. These observations are then turned into clear problem statements with user behavior, business impact, and actionable recommendations.
Following analysis, you want to present your findings in a structured report with an executive summary, methodology, and visuals, then tailor presentations to your audience. AI-first UX research tools like Maze automate reporting and use AI-powered thematic analysis to identify patterns faster, helping teams move from usability testing insights to product decisions without friction.
After a usability test, you’re usually left with a mix of session recordings, transcripts, task metrics, and scattered notes. You know there are usability issues in there, but it’s not always obvious which ones pop up frequently, how serious they are, or how to explain them to the rest of the team and wider organization.
This guide focuses on analyzing and reporting usability testing findings. We walk through how to translate usability testing data into clear patterns, prioritized issues, and a focused usability testing report that helps stakeholders decide what to fix next.
How to analyze usability test results step-by-step
Here’s how to review sessions, group similar issues, rate their impact, and turn them into clear findings for your team.
Step 1: Organize data & identify patterns
Once your usability tests are done, you have notes, recordings, and comments from real users. So, the first step to understanding them is to organize the issues you recorded during usability testing.
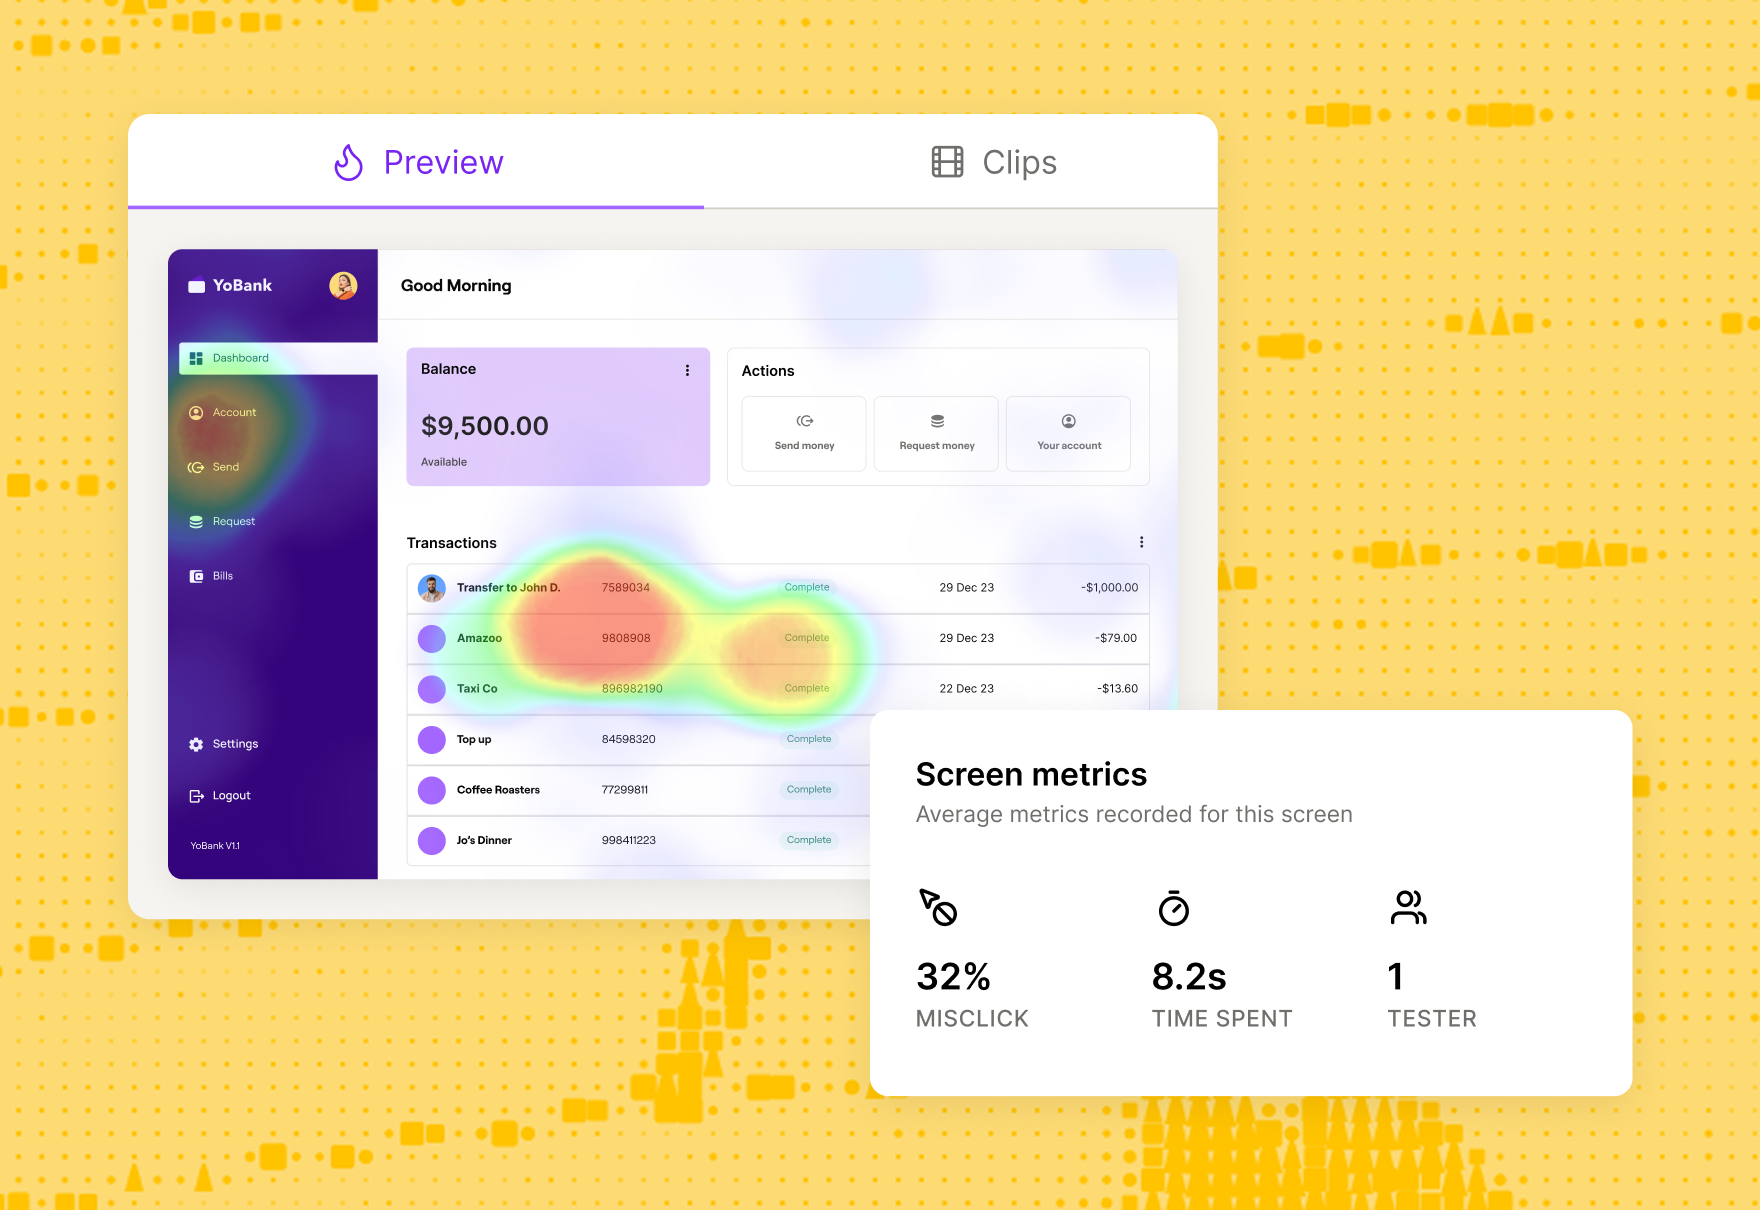
If you ran your study in Maze, the reports view shows you the quantitative data like:
- Task success rates: The percentage of participants who completed the task as intended
- Misclick rates: How often people clicked on the wrong element before finding the right one
- Drop-off points: The share of participants who abandoned the task before completing it
- Time on task: How long it takes people to complete the task, which signals where they had to slow down or think too hard
Once you spot patterns in the reports, investigate individual sessions to understand why they are happening. In the Sessions view, you can replay user journeys and see exactly where participants struggled, misclicked, or abandoned tasks. This is a form of clickstream analysis, showing the precise path people took through your design and the moments that slowed them down.
With Clips, you can also jump straight into key video highlights, review transcripts, and group themes to share the story behind those numbers with stakeholders.

In parallel, document your qualitative data and findings in more detail. For each problem you observed, note where in the design it occurred, what the participant was trying to do, what they actually did, and any relevant quotes or reactions. This gives you a clear record of both the quantitative impact and the qualitative context.
Alternatively, you can arrange the data in a table format according to one of the methods presented by Lewis and Sauro in Quantifying the User Experience: Practical Statistics for User Research. On one side, include each task with its respective issue. On the other, include a list of all your usability test participants so you can mark down every user who’s experienced the same issue.
Use affinity mapping to cluster related findings and start forming themes. Write one observation per digital sticky note (in Figma, Miro, or directly in Maze), then group notes with similar root causes.
For example, ‘couldn't find checkout button’ and ‘confused by nav labels’ might sit together under a broader theme like ‘navigation issues’. As you group and label these clusters (for example, ‘trust concerns’, ‘onboarding friction’, or ‘navigation issues’), you are effectively doing thematic analysis—coding recurring topics and rolling them up into a small set of clear themes.
Those themes become the bridge to your next step.
Remember 💡
If you've used heuristic evaluation methods, you'll already have a helpful testing structure and evaluation criteria to organize your results against.
Step 2: Prioritize issues based on criticality and impact
Not all issues discovered during usability testing are equally important. You need to categorize the problems based on the severity of the issues identified. Ranking your findings will make them more actionable and help you classify the issues you need to handle according to their priority.
According to NNGroup, we can categorize usability issues based on five severity levels:
Once you have assigned a severity level to each finding, use that scale to decide what to prioritize, taking into account how often the problem appears and what your team can realistically address. A problem that makes it hard for users to find or understand a key call-to-action is almost always more critical than a typo in supporting copy, even if the typo is quicker to fix. The goal is to protect task completion and trust first, then resolve lower-severity issues as time and resources allow.
Step 3: Turn findings into actionable insights
By this point, you’ve already grouped your findings, rated their severity, and decided which ones matter most.
Research results need to be organized, synthesized, and analyzed, preferably in a partnership or group to broaden the perspective.


Taylor Palmer
Product Design Lead at Range
Once you have that shared understanding, the next step is to express each key finding in a way that makes the behavior, impact, and recommended change obvious.
Take each prioritized finding and rewrite it using a simple three-part structure:
- Behavior: What users did or experienced
- Impact: Why it matters for the business or user outcome
- Recommendation: What do you suggest changing or testing next
For example, ‘Users clicked the wrong button’ becomes ‘65% of users mistakenly clicked Cancel instead of Submit because both buttons have identical visual weight, causing a 40% drop-off at checkout. Recommendation: Increase the contrast and size of the primary CTA to reduce misclicks.’
This three-part structure connects what you observed to measurable outcomes like conversion rates or task success, making it clear why the fix matters.
Step 4: Create a report
Once you've organized your data, prioritized issues, and turned findings into clear problem statements, it's time to package everything into a structured report.
Your report should include:
- Executive summary: A concise overview of key findings, validated assumptions, and top recommendations—written for busy stakeholders who need the main insights at a glance
- Goals and objectives: Background on what you set out to test and why (based on your usability testing plan)
- Methodology: How you conducted the test, including participant profiles, task scenarios, and tools used
- Key findings: The prioritized issues you identified, organized by severity (use the 0-4 scale from Step 2)
- Recommendations: Specific, actionable next steps tied to each finding
- Appendix: Supporting materials like session clips, full transcripts, or detailed data tables
Once your report is ready, the next step is to discuss and share it with stakeholders to turn insights into action.
Step 5: Discuss and share with stakeholders
Different stakeholders need different levels of depth, so tailoring your presentation ensures everyone gets what they need to act.
For example, executives and senior leadership typically need high-level summaries. This includes key findings, business impact, and prioritized recommendations that they can approve quickly. Product managers and designers, on the other hand, benefit from granular details like specific user quotes, session clips, and task-level breakdowns that validate design decisions.
The fundamental goal of usability testing is to build a product that your customers will be able to use. That’s why it’s important to involve people across the organization in both the research and the way you share results, from product and design to marketing, customer support, and senior leadership. When stakeholders see the real issues users experience, it is much easier to align on priorities, secure budget, and make confident decisions about what to fix next.
I’ve seen the most success with usability testing when designers, engineers, and product managers are involved in understanding how people actually use or don’t use a product. You want people who have the ability to make decisions to be involved, so you can make sure that all of your research is building a case for the important decisions that you want to make, whether that’s as a high level as 'Do we release this product?' or as focused as 'Is this a more usable menu?'


Behzod Sirjani
Founder of Yet Another Studio


What to include in your usability testing report
By this point, you’ve run your study, analyzed the sessions, and aligned on priorities. Now the goal is to capture that work in a report that others can quickly scan and act on.
A usability testing report does three things:
- Sets the context for the study and what you were trying to learn
- Highlights the most important findings and their impact
- Defines clear next steps, owners, and timelines
The sections below outline the core elements to include so your report is clear, actionable, and easy to reuse for future iterations.
Summary
First, include an overview of the usability test you ran. This should give anyone who was not involved enough context to understand what you tested and how.
Include:
- What you tested: The product area, flow, or prototype version
- Where testing took place: In-person, remote moderated, or unmoderated
- Tools used: Platforms or usability testing tools you used to run and record the study
- When it happened: Dates and times of the sessions or testing period
- Who moderated: Whether the sessions were moderated and, if so, by whom
This summary gives stakeholders a quick snapshot of the study setup before they dive into the findings.
Product tip ✨
When you run usability testing with Maze, you automatically receive an instantly-generated Maze usability report with all your results that you can share with the team.
Goals
Next, outline the main goals of your usability testing in a few sentences. This helps stakeholders understand what you were trying to learn, how to judge whether the study was successful, and how to interpret the findings that follow.
Here are five examples of specific objectives you could opt for:
- Test the new design of an upcoming feature
- Increase conversion rates on the sign-up flow by 30%
- Test your new user flow against the old one to confirm a design change
- See if on-screen instructions are clear enough
- Make it easier for people to complete goals in less time
Methodology
In this section, get specific on the different usability testing methods you used to run the tests. This includes information about the type of data collected (qualitative vs. quantitative) and details on the types of tests that were conducted. For the latter, specify if you focused on unmoderated or moderated usability testing and the location where tests were conducted (in-person vs. remote).
You also want to share the methods used to select the participants for your test. Here, focus on sharing screening information used to qualify participants, the number of user testing participants, and why target users were selected.
Participants
Here, share demographic information about the participants who took part in the study. This should include their age, profession, experience with similar technologies, and any other relevant data based on the target audience you defined in the testing plan.
A recommended best practice is to make sure you don’t mention their names to guarantee respondent privacy. Fictional names can be used instead to talk about a scenario or group of people.
Findings
This section is the core of your usability testing report, as it includes all the findings you’ve identified through analyzing your usability test results. Once you’ve prioritized the issues into categories, include the most critical findings in the report.
You can complement the main findings with usability metrics such as completion rates, time spent, or bounce rates for individual tasks. This data will help you back-up the findings, and make it easy for stakeholders to understand the problems. You can also highlight user comments or satisfaction rates to provide relevant context around an issue.
Actions
For each high-priority finding, include:
- Proposed change: What you recommend doing to address the problem
- Owner: The person or team responsible for making the change
- Priority and timeline: How urgent it is and when you expect it to be tackled
- Status (optional): For example, ‘planned,’ ‘in design,’ or ‘shipped,’ if you update the report over time
For example:
Finding: Users struggled to find the primary CTA on the checkout page, causing drop-offs.
- Action: Redesign the button hierarchy and spacing on the checkout screen
- Owner: Product design
- Priority: High, next sprint
This is also where cross-functional alignment happens. Recommendations should be discussed and refined with Product, Design, Engineering, and, when needed, Marketing or Support, then fed into your roadmap or upcoming sprint. The goal is to make it very clear which changes have been agreed, who is responsible, and how they connect back to the usability problems you identified.
An example usability testing report
Maze automatically generates a comprehensive usability report for every test you run, making it easy to analyze important UX metrics and share findings with your team. Here's what a typical Maze report includes:
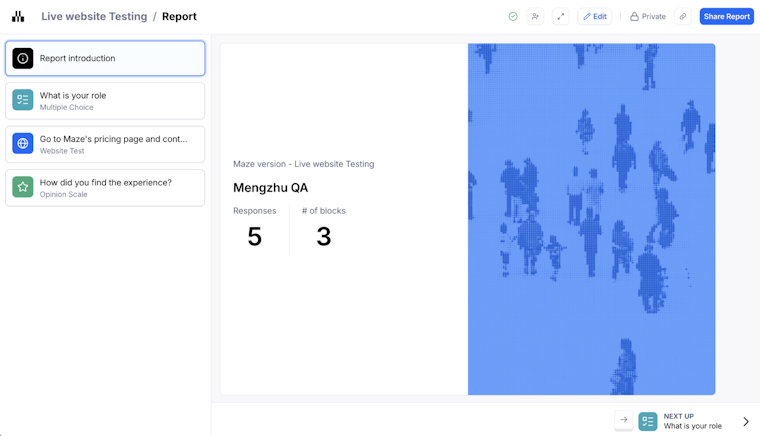
Report introduction
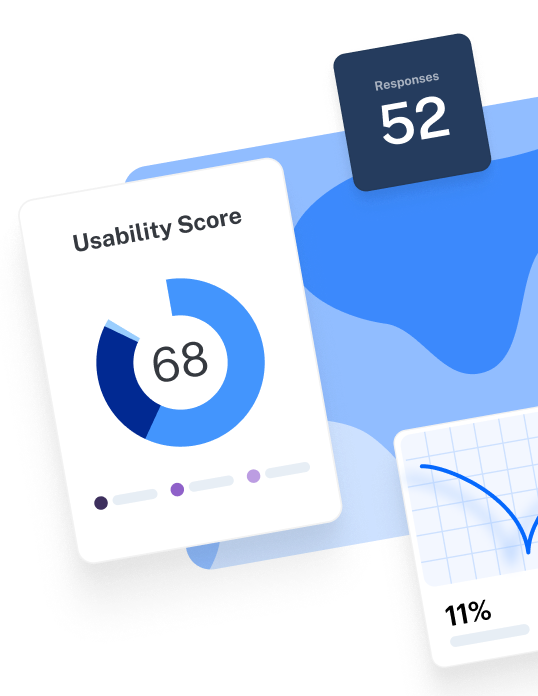
The overview shows your overall usability score (0-100), total number of responses, and the number of blocks tested. This gives stakeholders an immediate snapshot of how your design performed.

Usability score
Maze calculates a score for the entire test, each mission, and every screen based on three key indicators like success rate, duration, and misclick rate. Scores are categorized as High (80-100), Medium (50-80), or Low (0-50), making it instantly clear which areas need attention.
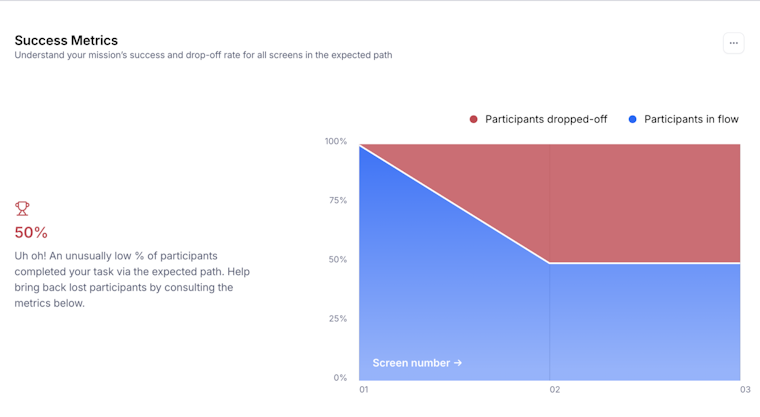
Mission analysis
Each mission (task) is broken down into detailed sections like usability metrics, mission paths, success metrics, and optimal path analysis.

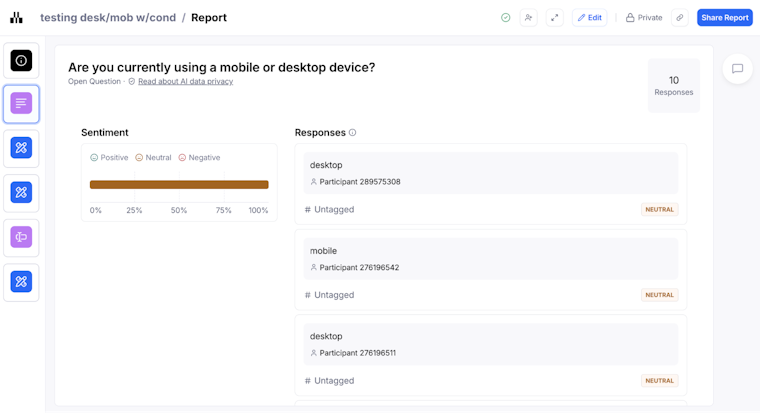
Question analysis
For surveys and follow-up questions, Maze displays visual representations of responses for closed questions (Yes/No, opinion scales, multiple choice) and text responses for open questions.

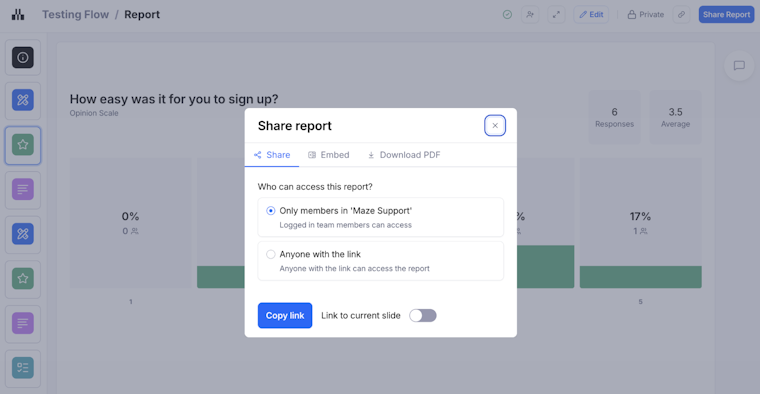
Maze reports also support inline commenting so teams can discuss findings, raise questions, and explore solutions directly in the report. You can present findings in full-screen Presentation mode, share via public link, embed reports in tools like Notion or Slack, or export as PDF for distribution. Raw data can also be exported as CSV for deeper analysis.

Advanced analysis: Metrics, AI, and continuous analysis
As usability testing evolves, new technologies are transforming how teams extract insights from research data. Advanced analysis means tracking experience metrics over time, connecting qualitative feedback to quantitative trends, and using AI to reduce the manual load of synthesis so research can keep pace with product decisions.
In practice, that looks like:
- Combining task metrics (success, time on task, misclicks, drop-offs) with longitudinal data (comparing the same flow across multiple releases, tracking metrics by cohort over several months, or monitoring changes before and after a redesign) so you can see whether changes actually improve the experience over multiple rounds of testing
- Using AI to cluster open-ended feedback, find recurring patterns, and flag outliers that might be easy to miss in long transcripts or large datasets
- Treating analysis as an ongoing loop, not a one-off exercise, so insights from each usability study feed into the next release and can be compared across versions
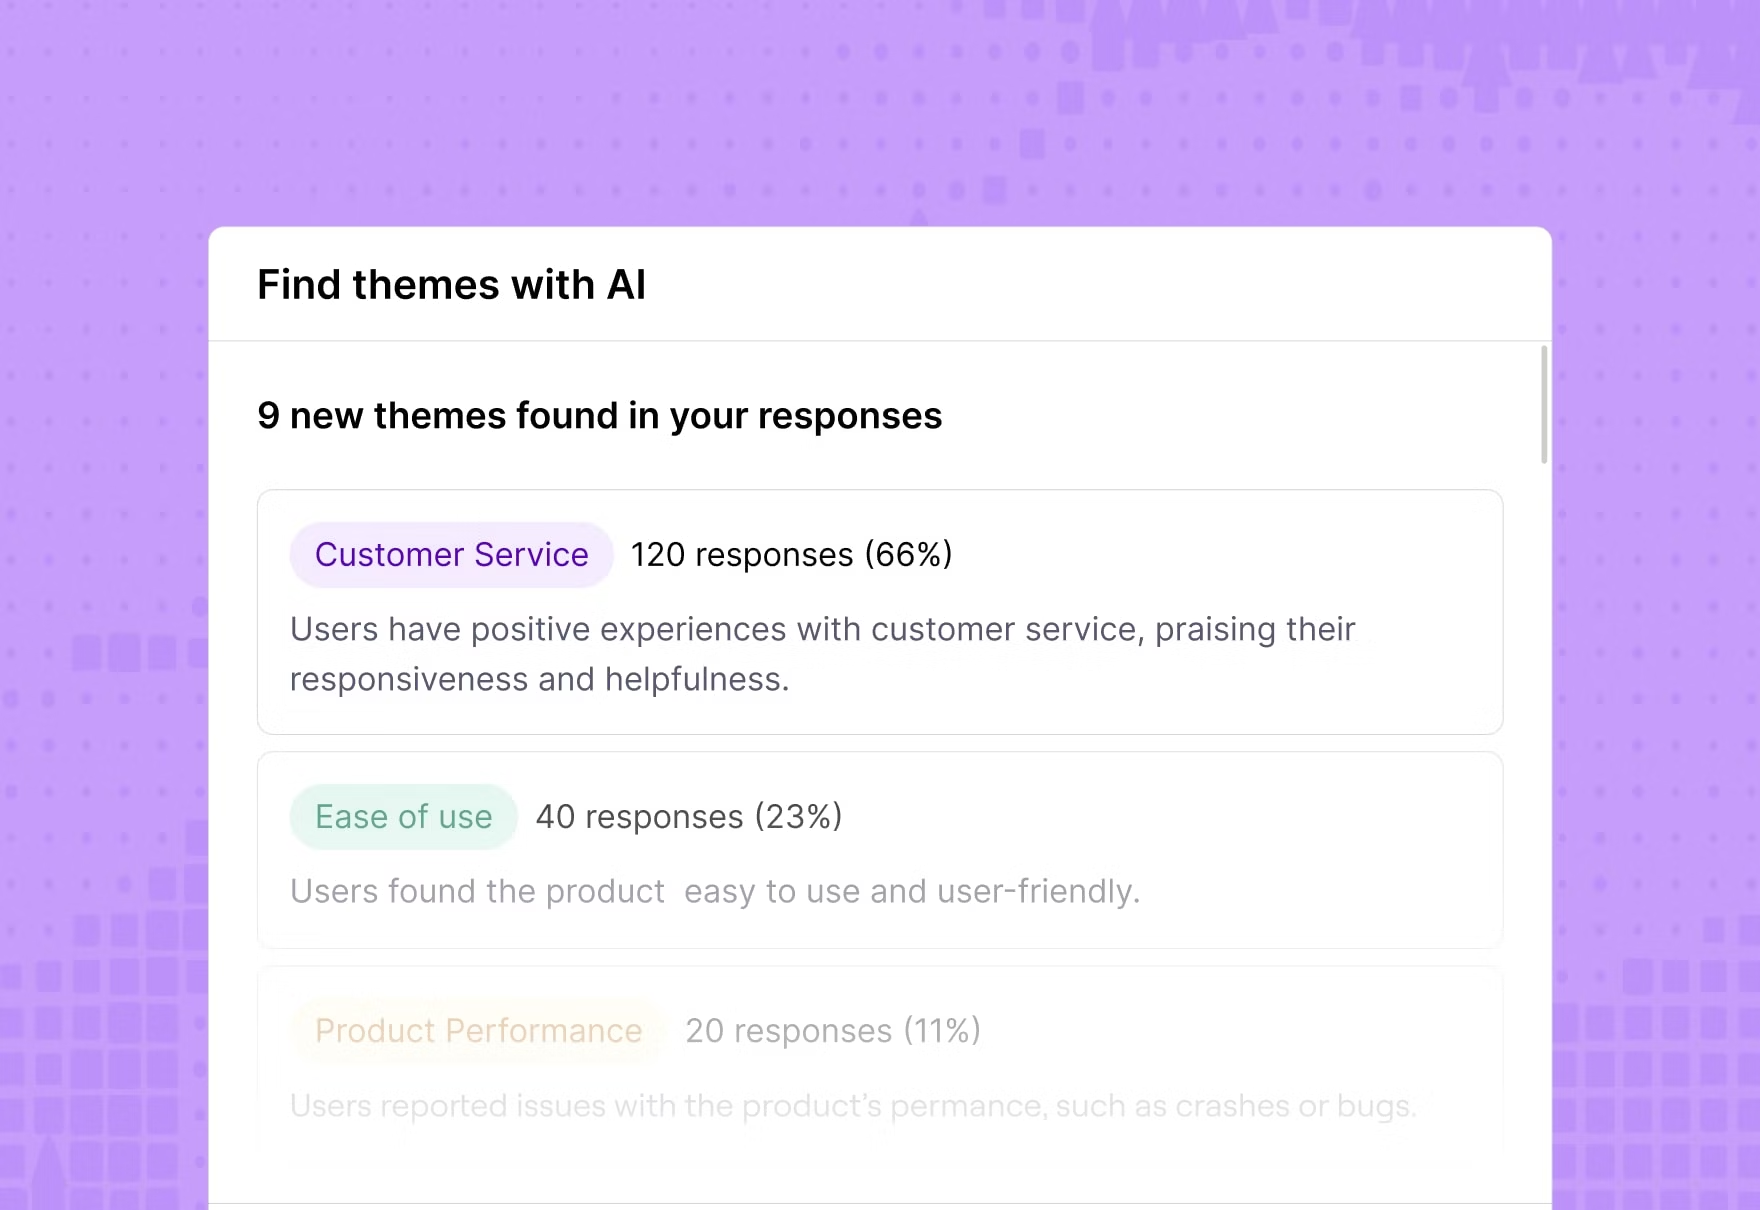
Maze supports this shift with AI-powered thematic analysis, which automates this process by scanning transcripts from user interview studies and identifying recurring themes in minutes.
The AI groups responses by topic, assigns logical theme names with color-coded tags, and shows the percentage of participants who mentioned each theme. You can filter insights by theme and sentiment, making it easier to prioritize which issues to address first. Maze also generates automated summaries and key takeaways that distill complex findings into digestible insights for stakeholders.

Turn insights into action
The findings you extract from your usability tests directly influence product decisions. This includes which feature gets prioritized on your roadmap, whether that redesign moves forward, or how you adjust onboarding to reduce drop-off.
Maze makes this entire process faster and more collaborative. From automated reports to AI-powered thematic analysis and seamless sharing with stakeholders via embedded links or PDFs—every step is designed to get you from test to action without friction.
When analysis becomes effortless, testing becomes a habit, and the product gets better.


Frequently asked questions about usability test results
How do you analyze the results of a usability test effectively?
How do you analyze the results of a usability test effectively?
Start by reviewing quantitative metrics like task success rates, completion times, and error rates to identify where the biggest problems occurred. Then, examine individual session recordings to understand why users struggled at those points.
Document every issue systematically, group related observations using affinity mapping or thematic analysis, and prioritize problems by severity using a 0-4 scale. Finally, turn each finding into a clear problem statement that connects user behavior to impact and includes a specific, actionable recommendation.
Which usability metrics are most important to track in my report?
Which usability metrics are most important to track in my report?
You should focus on three core categories. Effectiveness (task success rate, error rate), efficiency (time on task, misclick rate), and satisfaction (SEQ, SUS, or post-task ratings).
Together, these metrics reveal whether users can complete tasks, how smoothly they accomplish them, and how they feel about the experience. For maximum impact, combine quantitative metrics with qualitative observations from session recordings.
What should a usability testing report include?
What should a usability testing report include?
A usability testing report should include:
- Executive summary: Key findings and top recommendations
- Methodology: Participants, tasks, and tools used
- Prioritized issues: Organized by severity and impact
- Actionable recommendations: Clear next steps tied to each key finding
- Supporting visuals: Annotated screenshots, charts, or session clips
- Appendix (optional): Raw data tables or full transcripts for deeper review
How to present usability test findings with stakeholders who are short on time?
How to present usability test findings with stakeholders who are short on time?
Use a focused, business-first structure:
- Lead with an executive summary: One or two sentences per key finding, framed in terms of business impact (revenue, risk, customer outcomes, or strategic goals).
- Tie insights to objectives: Explicitly link each finding back to the original business or research objectives so it is clear why it matters now.
- Use visuals, not walls of text: Rely on charts, annotated screenshots, and short session clips instead of dense paragraphs.
- Speak their language: For executives, translate findings into OKRs, roadmap decisions, and KPIs. For designers and developers, highlight task-level breakdowns and UX details they can act on.
- Adjust depth by audience: Keep things high-level for stakeholder buy-in and only go deeper where team members need specifics to make changes.
How does Maze help with usability testing analysis?
How does Maze help with usability testing analysis?
Maze automatically generates UX reports with usability scores, success rates, misclick rates, and task breakdowns for every test. The Sessions view lets you replay individual user interactions to diagnose issues. AI-powered thematic analysis scans interview transcripts and open-ended responses to surface recurring themes in minutes, cutting manual coding time dramatically. You can share reports via public links, embed them in Notion or Slack, or export as PDFs for presentations.