


Chapter 8
Maze study analysis and results
You’ve launched your study, recruited participants, and collected responses. Now comes the most important step: turning raw feedback into actionable insights you can trust and use to make product decisions.
Maze is designed to support analysis across quantitative signals, behavioral data, and qualitative feedback—whether you’re reviewing a prototype test, survey, card sorting, tree testing, or moderated interview.
In this chapter, we'll cover:
- How results are organized across studies, participants, and sessions
- Analyzing results from unmoderated studies
- Reviewing results from moderated and AI-moderated interviews
- Exploring individual participant sessions
- Using Maze AI to identify themes and synthesize insights
- Capturing and sharing evidence with Clips
- Refining analysis with filters and segments
By the end of this chapter, you'll be able to confidently analyze research results, uncover key insights, and share evidence with stakeholders.
Where to find your user research results
Once responses start coming in, your results are available directly on your live study in the Results tab.
💡 To see the most up-to-date data, simply refresh the page. Results update in real time as participants complete the study.
Maze gives you two primary ways to look at your user research data:
- By block: Explore results for each screen, question, or activity in your study. This is where you’ll see usability and experience metrics like task success and time on task, paths and screens visited, and answer distributions, depending on the block type.

- By participant: Explore what happened in each individual session from start to finish. You can review how a single person moved through the study, what they clicked, how they answered follow‑up questions, and how their behavior compares to other participants in your pool.

You can use both views. Block‑level results help you quickly spot patterns in user behavior and usability issues, while participant‑level sessions add the context you need to explain those patterns to stakeholders and decide what to change next.
Analyzing unmoderated Maze results
Unmoderated studies combine scale with behavioral and attitudinal data. Maze structures the results from these studies around the building blocks of your Maze (which you set up in chapter 3 of this guide). So you can move easily between high-level usability trends and underlying behaviors that drive them.
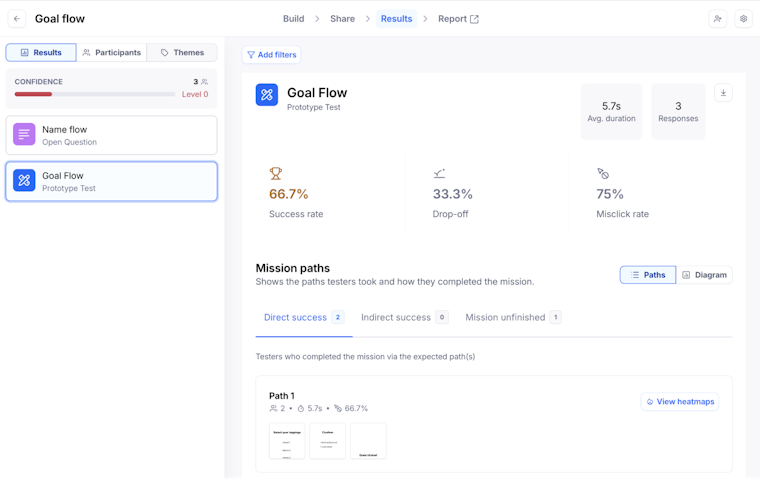
Analyzing task-based usability metrics
For unmoderated studies like prototype tests and live website tests, goal-based tasks are the backbone of your usability analysis. Each task shows you how participants finished a flow, how long it took, and how much effort it required.
In goal-based tasks, paths are grouped into three categories:
- Direct success: The task was completed via one of the expected paths you defined
- Indirect success: The task was completed via an unexpected path, but still reached the final screen
- Task unfinished: The task was not completed; participants ended on the wrong screen or abandoned the task
Don’t stop at success rate. A task can show a high percentage of completed tasks and still feel hard to use if the average duration is long or the misclick rate is high. Both are strong signals of friction in the flow.
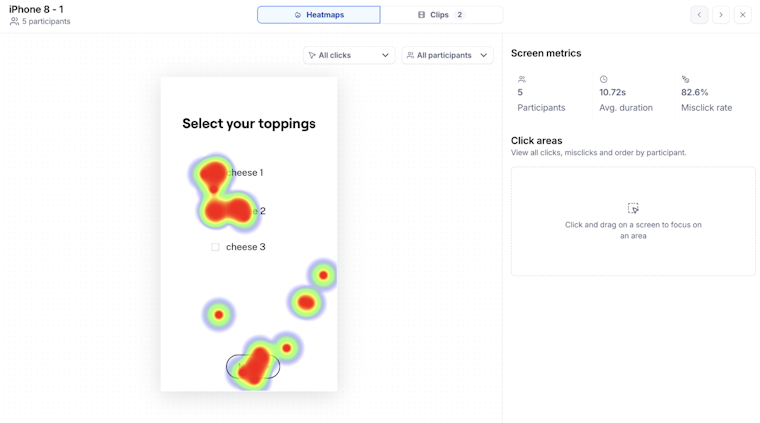
To understand what’s causing that friction, look at your goal-based task paths and heatmaps together.
Goal-based task paths show which routes testers took through the flow and how often they followed or deviated from your expected paths. Heatmaps show where people clicked, what they missed, and which elements drew unexpected attention, so you can pinpoint where the flow is breaking down.
Maze also provides heatmaps at multiple levels to help diagnose why outcomes occurred:
- Path-level heatmaps reveal the most common routes participants took and where they diverged from expectations
- Screen-level heatmaps highlight areas of attention, clicks, and hesitation that may indicate confusion or false affordances
- User-level heatmaps let you review individual interactions in detail to understand context and intent

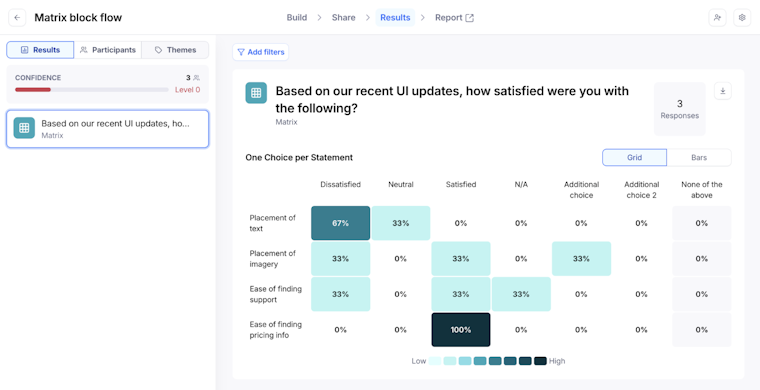
Analyzing closed-ended questions for fast data analysis
Closed-ended questions like multiple choice, opinion scale, yes/no, and matrix give you quick, structured data you can slice and compare. When you select one of these blocks in the Results tab, you’ll see an aggregated view at the top (counts and percentages for each option), with individual responses listed below.
Use this view to:
- Spot top answers: See which options concentrate most responses, which ones are rarely selected, and how evenly opinions are distributed. This helps you quickly validate assumptions or flag options that aren’t resonating.
- Compare segments with filters: Apply filters based on participant metadata or specific answers (for example, only testers who failed a task or belong to a certain demographic) to see how different groups respond to the same question. This is a fast way to connect task outcomes to attitudes. This is a fast way to connect task outcomes to attitudes and deepen your Maze research analysis.
- Export for deeper analysis: If you need more advanced analysis or correlations outside Maze, export question results as a CSV and work with them in your spreadsheet or BI tools.

💡 Treat closed-ended questions as your quickest read on patterns across participants. They summarize sentiment and preferences clearly, and filters let you connect those patterns to specific user behaviors in your task.
Analyzing open-ended questions for user needs and behavior
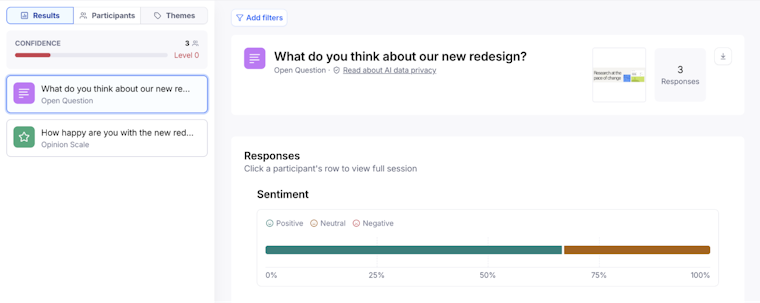
Open-ended questions help you capture how testers describe their experience in their own words—what they noticed, where they struggled, and what they expected to happen. When you select an Open Question block in the Results tab, you’ll see AI summaries and sentiment at the top, with individual responses listed below.
Use this view to:
- Understand overall sentiment: See the AI-generated sentiment breakdown for the question (Positive, Neutral, Negative) to get a quick read on how people feel about a flow, concept, or experience. You can override sentiment on individual answers if the AI misses the nuance.
- Identify recurring themes: Use Maze AI to group responses into topics, such as navigation issues or missing information. This helps you move from a long list of comments to a clear picture of which user needs and pain points come up most often.
- Review full conversations when you need depth: Scroll down to see summaries and the full text of each response, including any AI-generated follow-up questions and answers if you enabled it. Follow up on answers.
- Slice qualitative feedback by behavior or segment: Apply filters to narrow responses by participant metadata or by block outcomes (for example, only testers who failed a task or only a specific audience segment). This helps you connect what people say in open-ended questions to what they did elsewhere in the study.

💡 Use open-ended questions to turn raw comments into clear themes about user needs and behavior, then pair those themes with your task metrics to decide which usability issues to address first.
Analyzing information architecture tests (card sorting and tree testing)
Card sorting and tree testing help you see whether your structure matches how people think about your content and where navigation breaks down. The results focus on agreement and paths, so you can refine labels, groupings, and hierarchy.
For card sorting (open and closed), use the results view to:
- See how categories come together: Categories with the same name are automatically grouped, and you’ll see the average agreement for each category and the cards. High agreement means most maze users sorted those cards together; low agreement suggests labels or groupings aren’t intuitive.
- Dig into individual cards and their mental models: In the 'Your cards’ view, check the average agreement for each card and which categories it was sorted into. Cards with low agreement or many different categories often need a clearer label or a different place in your IA.
- Use matrices to spot patterns faster: Use the agreement matrix to see which cards cluster under specific categories and the similarity matrix to see which card pairs participants consistently grouped together. These visuals give you a quick starting point for drafting or adjusting your sitemap.
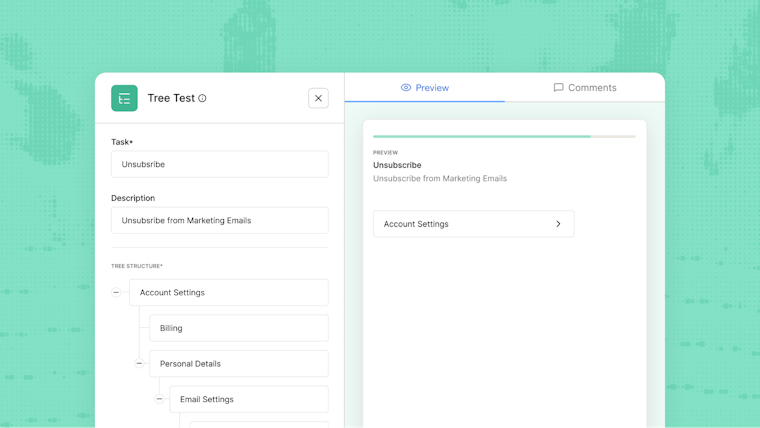
For tree testing, focus on whether people can find things in your structure:
- Check task success and destinations: Review where participants ended up in the tree for each task to see whether they landed in the correct section or drifted into the wrong branch. This tells you if your labels and hierarchy are doing their job.
- Review common paths through the tree: Look at the most frequent paths participants followed to reach their final choice. Use this to see where they hesitated, backtracked, or chose a sibling node instead of the intended one, then adjust labels or placement accordingly.

Analyzing moderated Maze results
Maze supports two types of moderated studies:
- Human-moderated studies, where a researcher facilitates sessions manually
- AI-moderated studies, where Maze’s AI conducts sessions and captures insights automatically
Both generate rich qualitative data. The key difference is how much synthesis Maze provides upfront versus how much analysis the researcher performs manually.
First, we’ll focus on analyzing results from human‑moderated interview studies, then look at AI‑moderated results in the next section.
What’s shared across all moderated studies
Regardless of the moderation type, every study gives you:
- Sessions with transcripts you can scan and search: Recordings are transcribed automatically, so you can jump to key moments.
- Highlights that capture the moments that matter: You can select clips and transcript excerpts from any session and save them as highlights. These are the building blocks you’ll later group into themes and use to support your insights.
- Themes that show patterns across interviews: In the Analyze tab, highlights are clustered by theme, helping you see which needs, behaviors, and pain points show up again and again.
- Interview reports you can share with stakeholders: Maze generates a report for every moderated study with at least one highlight, with slides for themes and per‑participant views. (More on Maze reporting in the next chapter.)
Reviewing human-moderated studies
Human-moderated studies rely primarily on manual analysis of:
- Session recordings (video and audio)
- Transcripts
- Moderator notes and timestamps
- Participant metadata (segments, screener answers)
A typical review process includes:
- Session-by-session review: Watch recordings or scan transcripts to understand context and flow. Use notes or timestamps to revisit key moments (confusion, friction, delight).
- Manual insight extraction: Identify usability issues, mental models, unmet needs, and expectations. Pull representative quotes and observations.
- Cross-session synthesis: Compare findings across participants. Look for frequency and consistency to validate insights.
- Theme building and reporting: Group observations into themes. Translate insights into recommendations or next steps.
Reviewing AI-moderated Maze results
AI-moderated studies are designed to accelerate analysis by surfacing insights automatically. After the AI moderator runs its first session, the Analyze page gives you an aggregated view of highlights clustered into themes, plus tools to refine and share those findings.
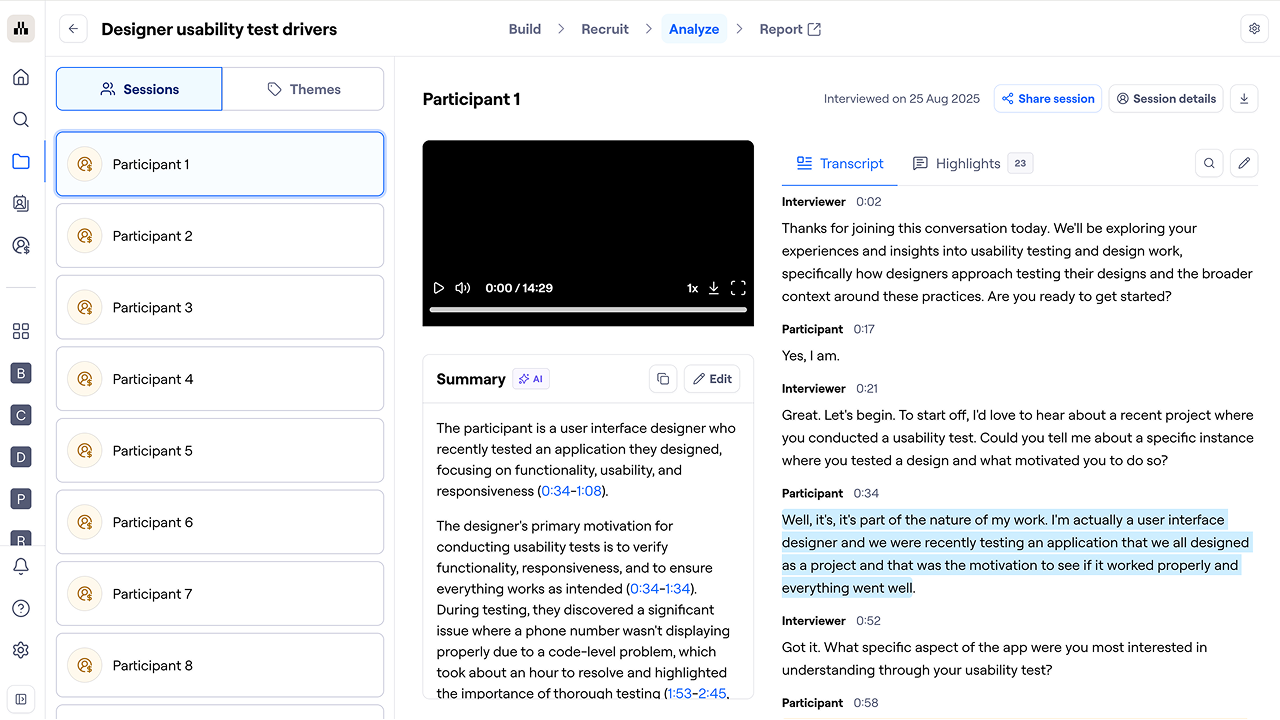
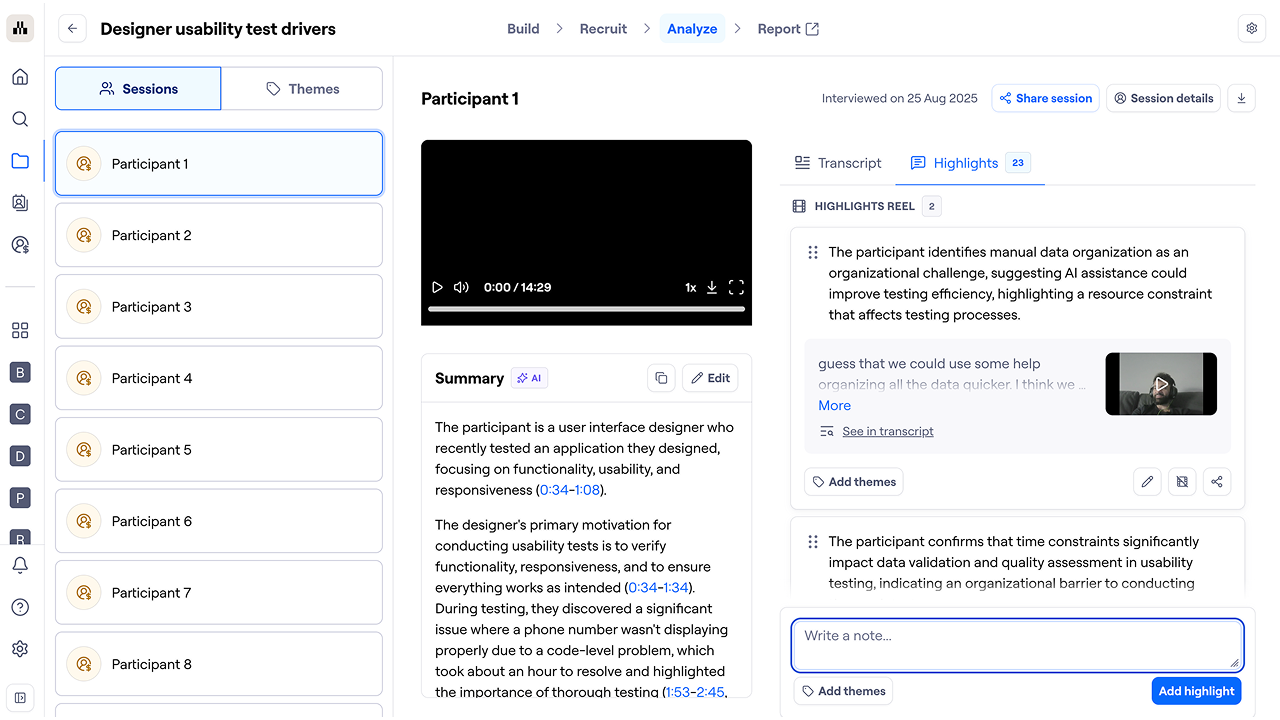
- Review sessions: Use the Sessions tab to see every participant, with their recording, transcript, AI summary, and automatically generated highlights. This is where you check how the AI handled the conversation, add any highlights it missed, and create a highlight reel for an individual session if you need it.

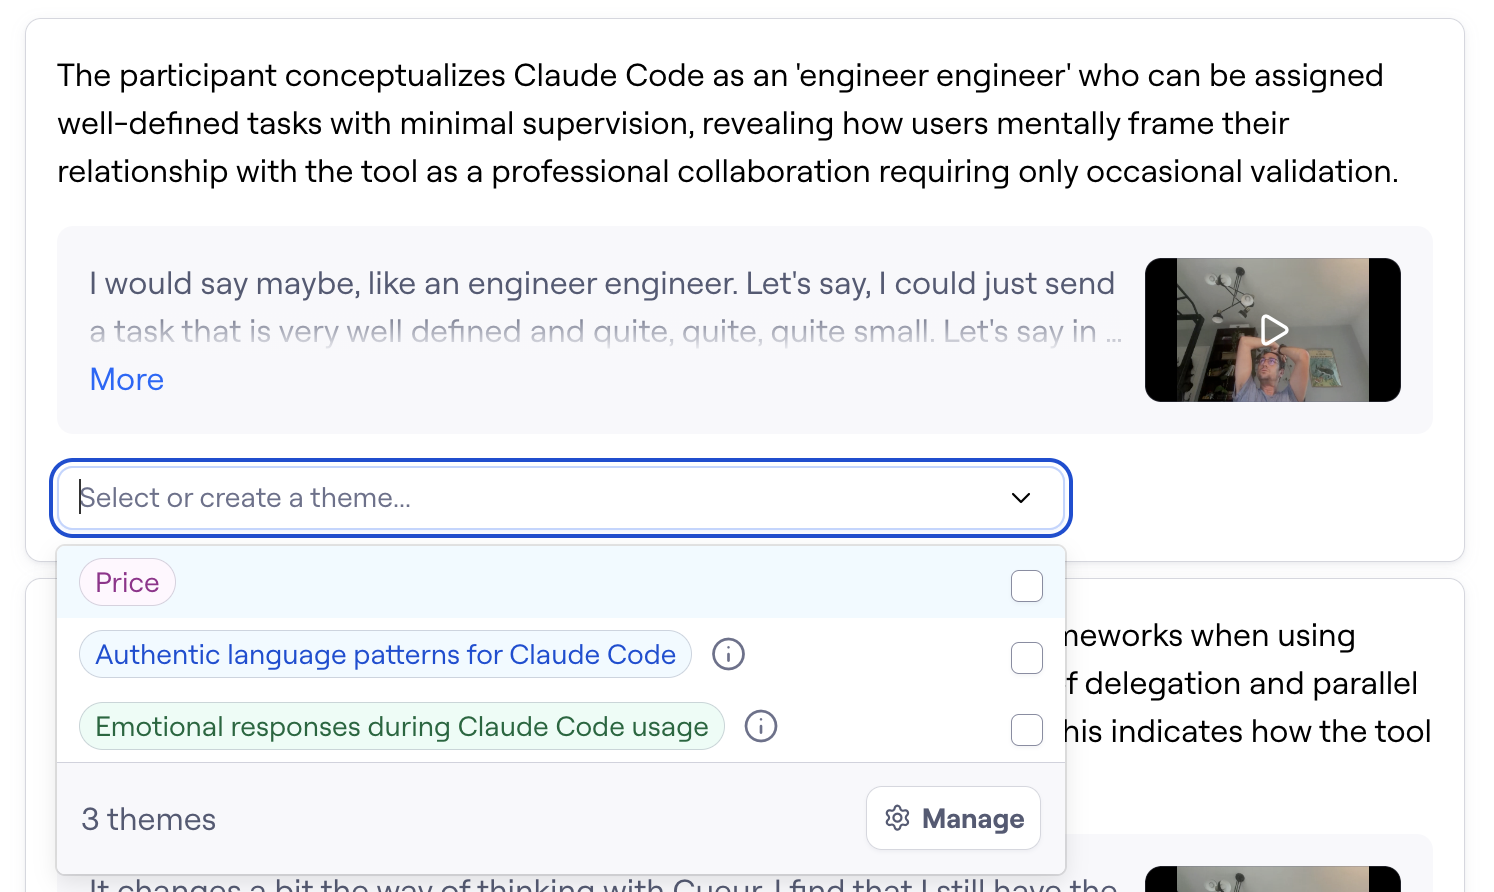
- Run thematic analysis: Move to the Themes tab and run thematic analysis to let Maze AI identify patterns across sessions. Thematic analysis scans all transcripts to find topics, sentiment trends, and themes and shows how many sessions contributed to each one. You can start with AI‑generated themes or add your own for the AI to take into account.
- Review and refine themes: After analysis, each theme shows session coverage, sentiment, AI‑generated insights, and the highlights attached to it. Use this view to see which needs or issues appear most often and edit summaries and key findings
- Create theme highlight reels: Within a theme, you can add highlight reels to showcase key moments and quotes across interviews. You can trim and reorder clips, then share the reel via link, embed, or download to help stakeholders see and hear the evidence behind your themes.

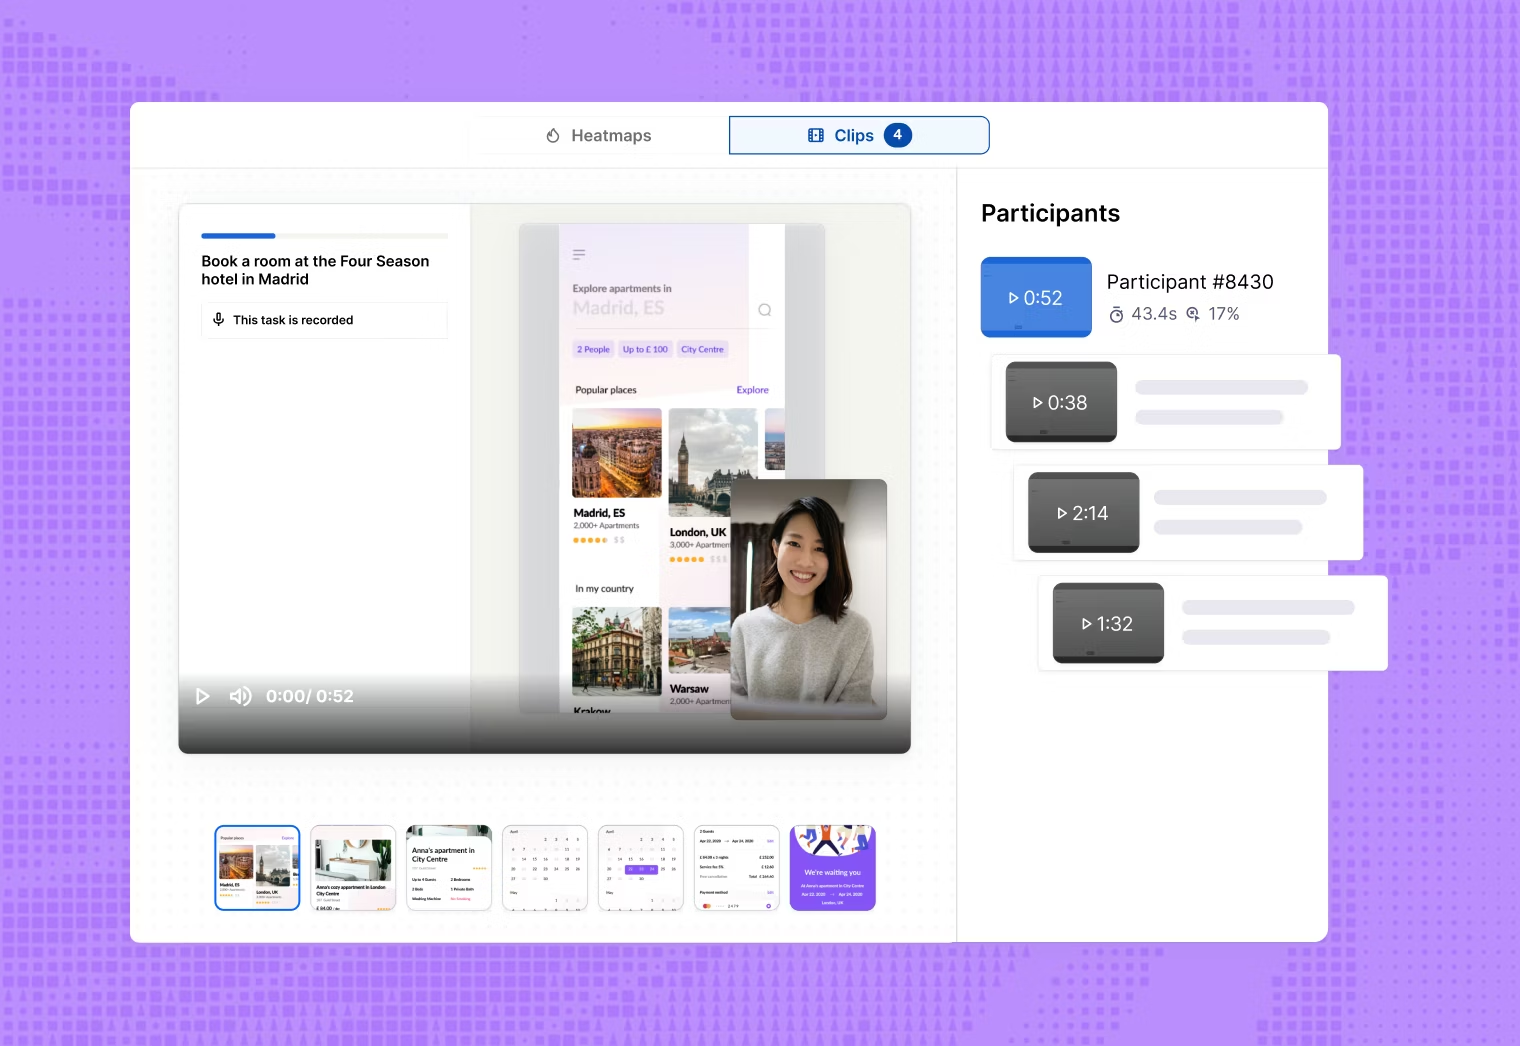
Capturing and sharing insights with Clips
Clips let you turn moments from sessions into short, shareable evidence. Use clips to:
- Highlight usability issues or moments of confusion in context, with both the screen and the user’s reactions
- Share direct customer feedback with stakeholders, so they hear comments and see body language firsthand
- Anchor insights in real user behavior by pairing clips with the corresponding task outcomes or question responses
When reviewing clips, you can create highlights and tag themes. Reels are automatically generated from themes, making it easier to build a cohesive research narrative and share it with stakeholders.

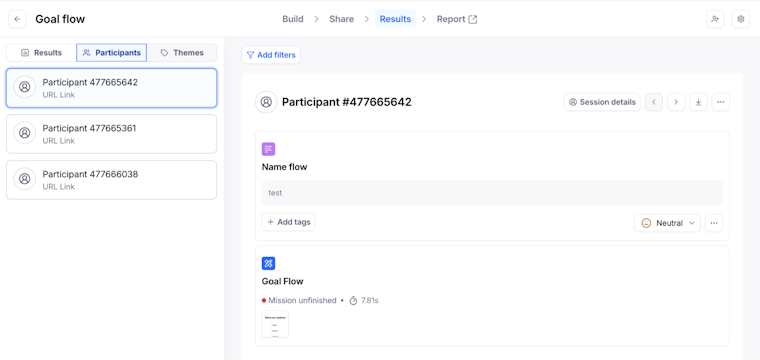
Reviewing sessions by participant
Block-level results show patterns across your data. When you need to understand what happened for a specific person, use the views that show full sessions for each participant.
Maze gives you two main ways to review results by tester:
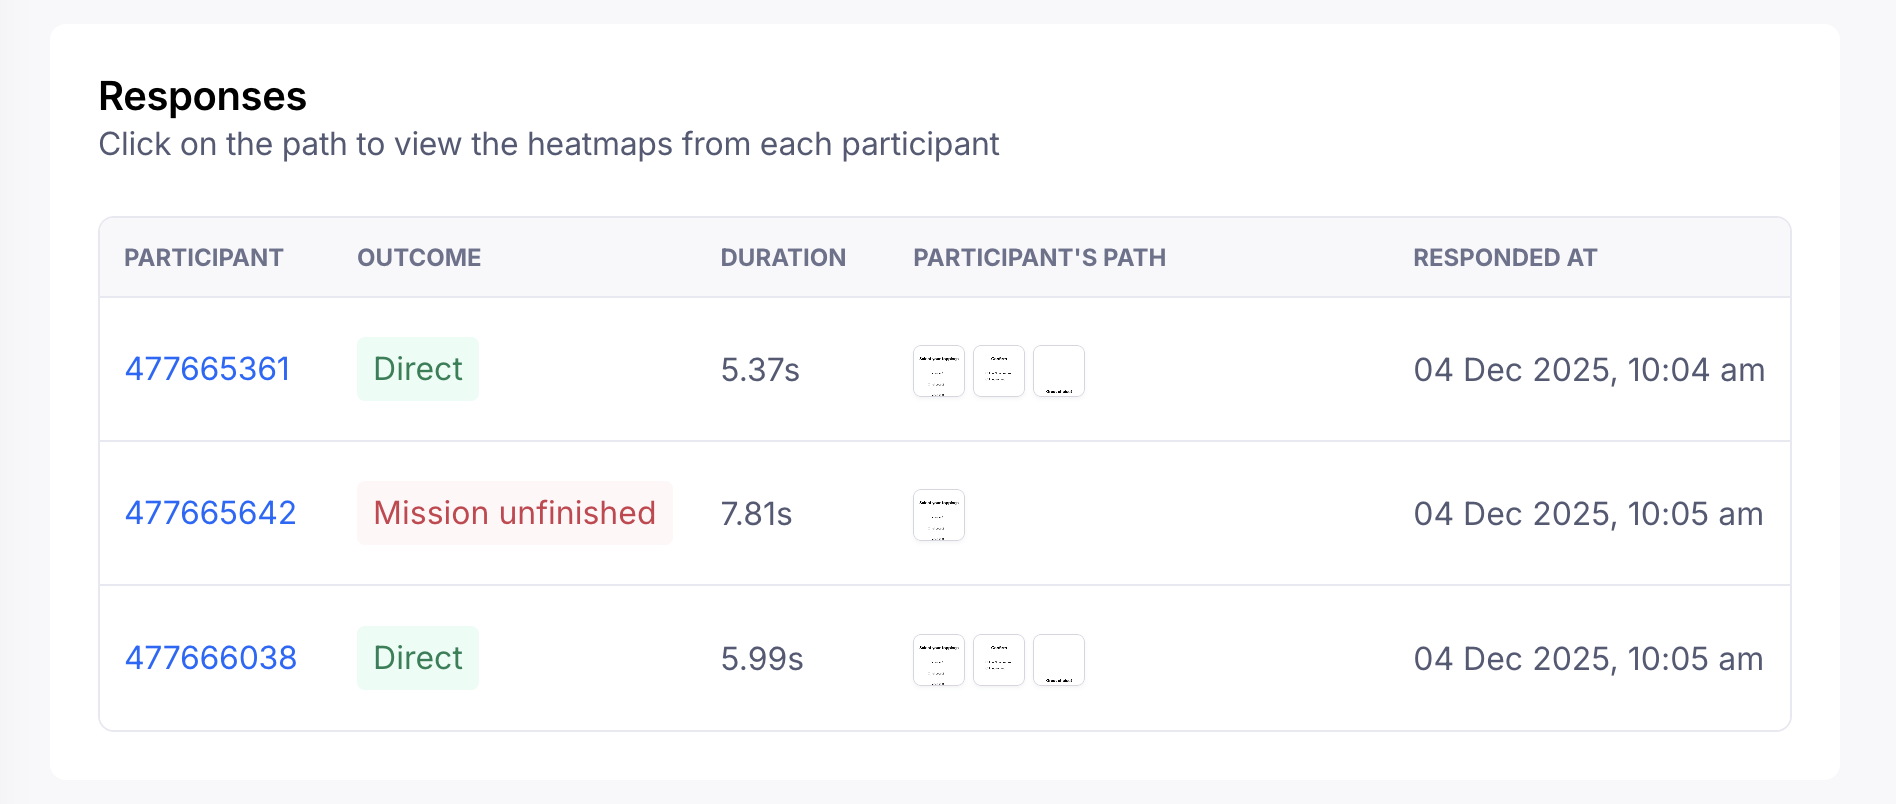
1. Responses (for unmoderated studies): In unmoderated studies like prototype tests, website tests, or surveys, the Responses table shows individual results for each participant. For every row, you’ll typically see:
- Outcome (for example, task success or unfinished)
- Duration
- Path thumbnail or screens visited
- Clips, if you enabled screen, camera, or audio recording

2. Sessions (for moderated and AI-moderated studies): In moderated and AI-moderated studies, the Sessions view lists each participant session. For every session, you’ll see:
- Recording and transcript
- Session-level summary and automatically generated highlights (for AI‑moderated)
- Any additional highlights you or your team added
- Basic participant details and timing

This view is especially useful when:
- Investigating unexpected results
- Debugging confusing flows
- Pulling concrete examples to support a finding
Pair session reviews with aggregated data to avoid over-weighting edge cases.
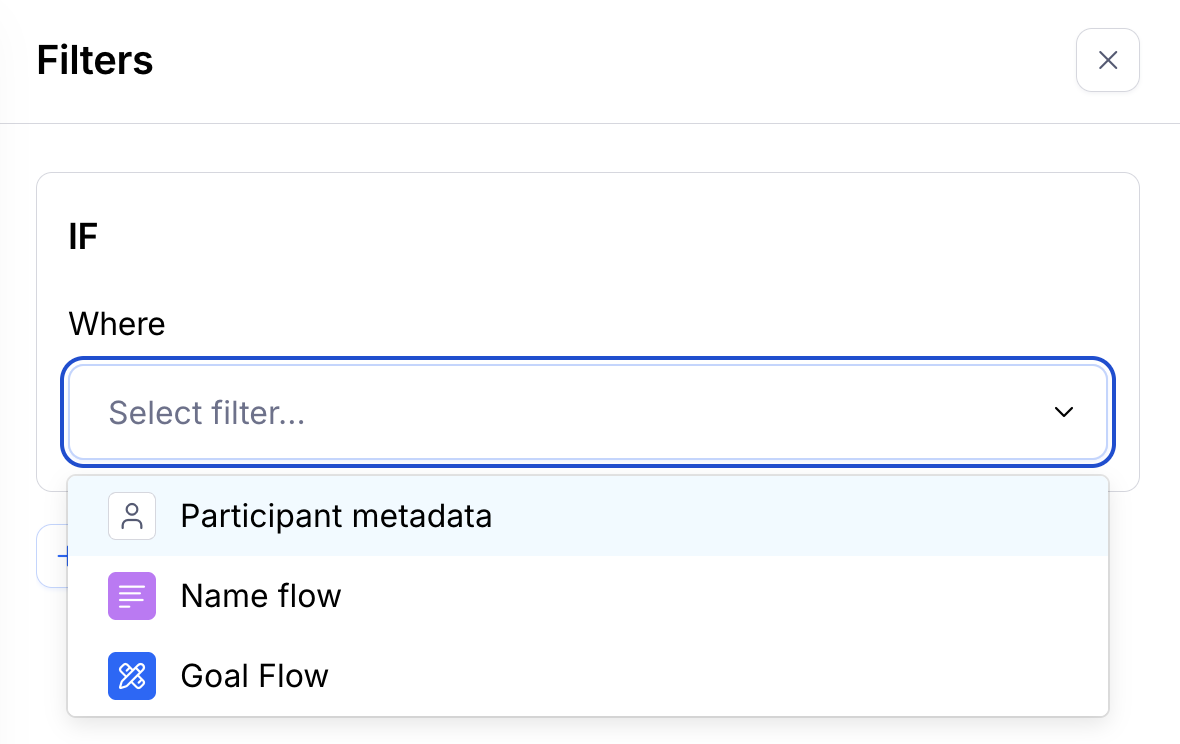
Using filters to refine your research questions
To go deeper, Maze lets you filter results based on participant attributes or responses, including:
- Participant details such as device type, browser, language, recruitment method, study completion status, and session duration
- Answers to specific questions, like only participants who chose a certain concept or gave a low satisfaction score
- Block outcomes, such as only testers who failed a key task or only those who completed it via an indirect path

Filters help you answer targeted questions like:
- How did first-time users differ from power users?
- Did participants who failed a task share a common trait?
- How did sentiment vary by segment?
Filtered views help ensure insights are contextual and avoid overgeneralization.
From results to insights
Analysis in Maze is iterative. Start with aggregated results to understand what is happening, then zoom into sessions, themes, and clips to understand why.
Up next: Reporting with Maze
With analysis done, your focus turns to reporting. Next, we look at how to turn your analysis into clear, shareable outputs using Maze reports, so findings are easy to present, discuss, and act on across your team.